Here are several more maps that are helpful for understanding the COVID-19 spread in Iowa.
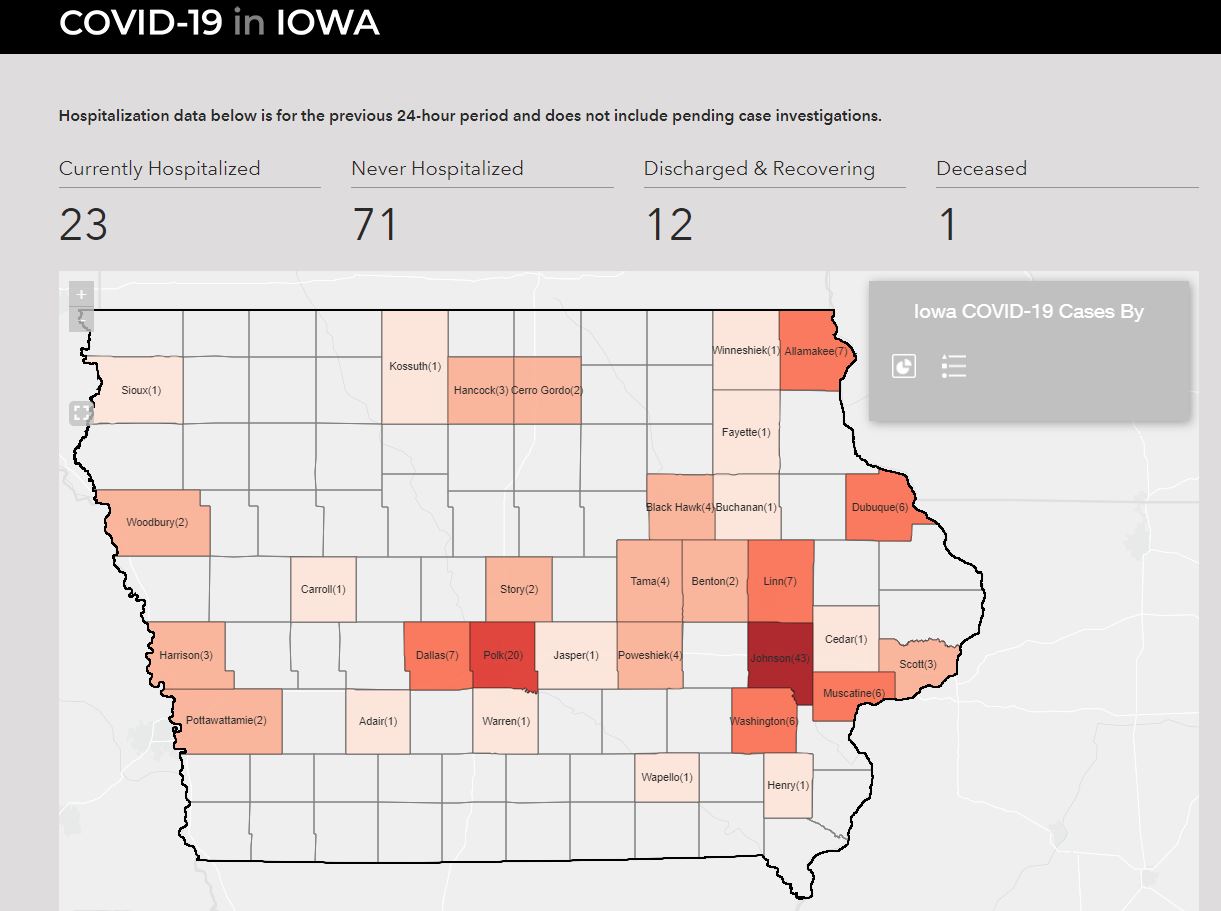
The State of Iowa has a COVID-19 page: https://coronavirus.iowa.gov/. There is a map of the the confirmed cases statewide. This page has demographic breakdown of the cases by male/female, age cohorts, as well as hospitalization and recovery information.
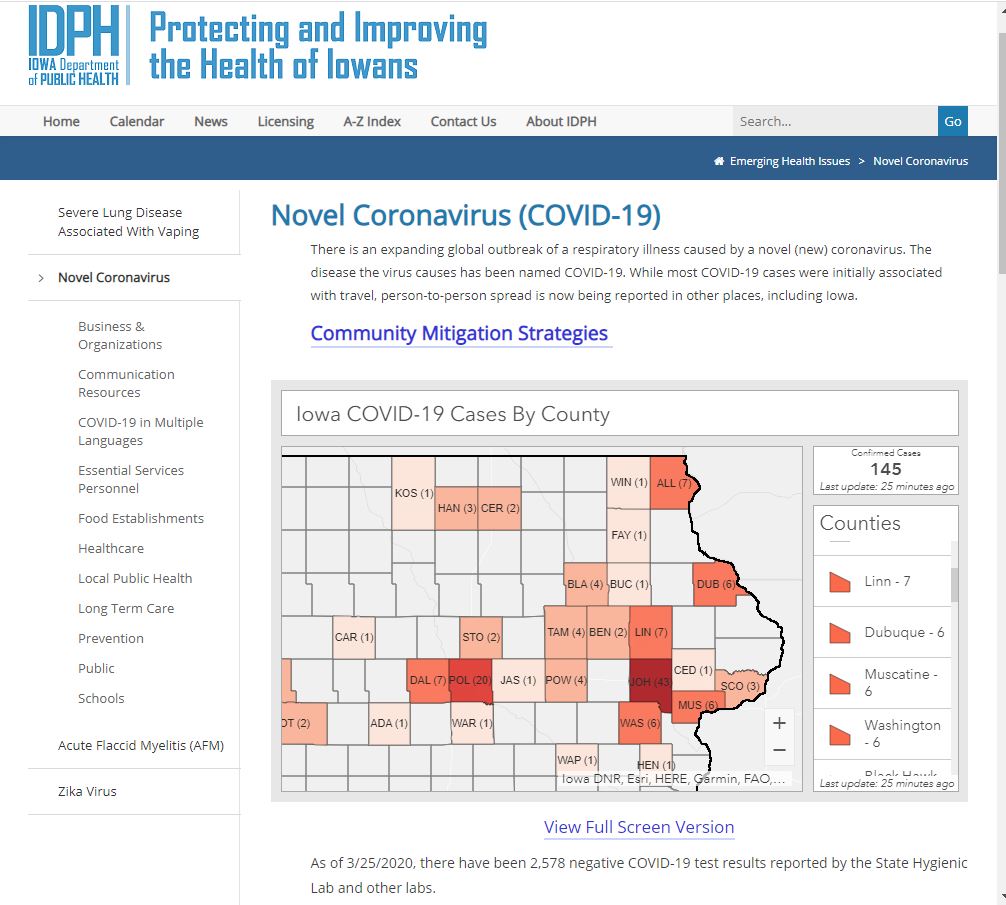
The Iowa Department of Public Health has a similar page: https://idph.iowa.gov/Emerging-Health-Issues/Novel-Coronavirus. One thing I like about the IDPH page is that they have the number of negative COVID-19 tests as well as the positive cases.
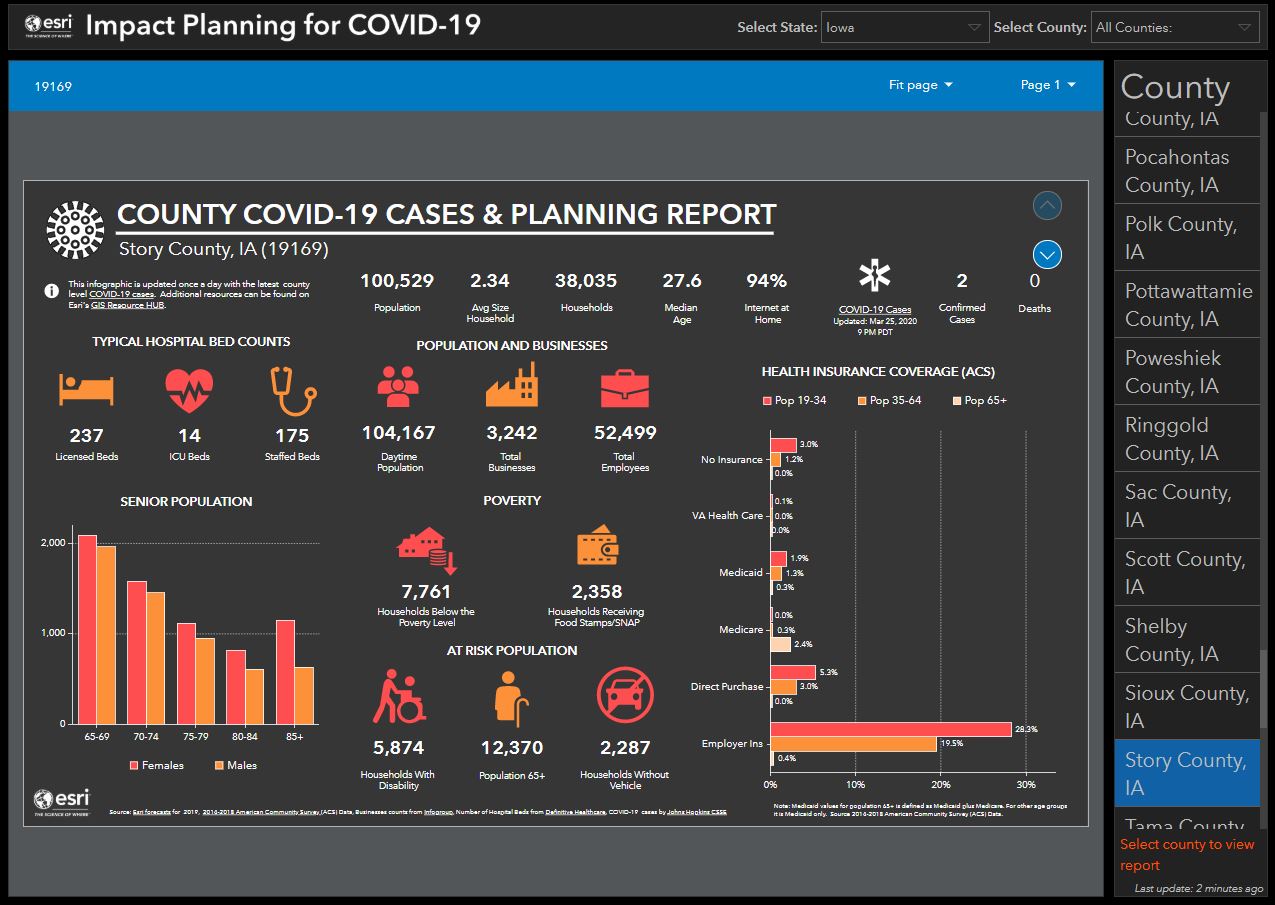
An interesting infographic site that is put out by ESRI called Impact Planning for COVID-19: https://business.maps.arcgis.com/apps/opsdashboard/index.html#/dc74772707d94db9a7d24d30ffdcf36c. This site pulls together demographic data, hospital data, insurance data to give a snap shot of each county around the country.