Category Archives: COVID-19

Not ITAG 2020: Tales from the Geospatial Bunker

This year due to safety concerns with the COVID-19 pandemic the Iowa Technology and Geospatial (ITAG) Conference 2020 was cancelled. Instead of the typical four-day in person event, ITAG hosted a half-day virtual event. Here is the link to the recording: https://drive.google.com/file/d/1Y31tVqT2Y2dt68kFsefBqSNOTzq0ycIj/view?usp=sharing. Below are descriptions of presentations and links to presenters’ powerpoints:

What’s New with Collector for ArcGIS
Jay Riester and Gale Shea, Seiler Geospatial
Collector for ArcGIS is an ever-evolving field app. Learn what’s new with both the iOS and Android version of Collector.

DEMs – Which One Do I Choose?
Brian Gelder, Iowa State University
The ready availability of Lidar and Phodar datasets has vastly increased the types of Digital Elevation Models that are now available. One can now generate or choose from surface models and elevation models with some having various levels of hydroflattening or hydrocorrection applied. There are also numerous algorithms which can be used to generate the different types of DEMs. So, how does one choose which one is best for the needs of one’s project? We will discuss general DEM types, the underlying assumptions, best choices for certain applications, and sources for prebuilt DEMs for the state of Iowa.

Mapping the Rural Hitch – How One Fire Department Is Utilizing GIS to Prepare for Rural Structure Fires
Adam Gebhart, Johnson County
Traveling around most urban areas, you see fire hydrants or access to a continuous water supply every few hundred feet. However, when traveling around rural portions of the state, these types of continuous water resources are rarely found. This lack of continuous water resource poses a
considerable challenge for local fire departments when responding to fires in rural areas. When a fire occurs, response time is everything. Given the considerable challenges in effectively responding to fire emergencies in rural areas, North Liberty Fire Department (NLFD) is one place utilizing GIS
technology to improve these response times. This presentation will provide background information on mapping the rural hitch to help other fire departments understand how GIS can improve their response to rural fires.

How Data “Moves” in a Versioned Enterprise Geodatabase Workflow
Nathan Teut, Cedar County
The ability to branch child versions off of other versions in a multiuser geodatabase tree structure gives us the ability to edit without stepping on each other’s toes or eating each other’s brains. This also allows QAQC protocols to be put into place when migrating those edits (reconcile and post operations) into the parent versions. To better understand these editing operations, it is necessary to understand the version tree and the concept of state IDs which can be easily viewed through SQL Server Management Studio. In a demo-based presentation, let’s go through an editing example, tracking the advancement of a zombie apocalypse upon Cedar County, by two simultaneous users, and check the state IDs to better
understand how the data “moves” from child to parent. Finally, lets quickly review the arcpy methods for automating reconcile, post, and geodatabase maintenance (rebuild, analyze, and compress operations).

Playing Nice with Your Neighbors NG911
Jeff Miller, Dubuque County
This will be a county focused meetup to discuss boundary and alignment issues between counties. For Next Gen 911 to work as expected the boundaries need to be edge matched and roads need to be connected at county boundaries.

GIS Leadership in an Organization and Best Practices for GIS Success
Matt Hoehn and Dan Haag, Esri
Esri’s Dan Haag (St Louis Region Manager) and Matt Hoehn (Account manager for Local governments in Iowa) will be presenting on lessons learned and best practices for GIS and IT professionals to use Location Technology to become leaders in their organizations. Presentation and discussion topics include; GIS and technology strategy, focusing on capabilities, establishing GIS value with business focused solutions, overcoming technology challenges, and implementing best practices.

Missing your Mapping Peeps?

Join the OpenStreetMap US Virtual Mappy Hour. Members of the OpenStreetMap (OSM) Community present short, informational talks related to OSM and other mapping related topics. Here are links to some the past and upcoming Mappy Hour topics.

Up-to-date Events Schedule: https://wiki.openstreetmap.org/wiki/Foundation/Local_Chapters/United_States/Virtual_Mappy_Hours (To attend in real-time you will need to register on the form)

Upcoming Events
Wednesday, May 13, 2020 8:30pm ET – Imports with Margaret Spyker

Wednesday, May 27, 2020 8:30pm ET – Topic to be determined

Friday, June 5, 2020 6:30 -8:30pm ET – NY Mapathon Part 1: Mapping houses in the town of Hempstead, NY

Tuesday, June 9, 2020 8:30pm ET – Brian DeRocher, Microcosm

Wednesday, June 25, 2020 – Topic to be determined

Past Events
Thursday, April 30, 2020, Mapathon w/ MaptimeBmore – (watch) Mapping POIs in response to COVID-19 (BNIA Part-1), Mapping POIs with COVID tagging (Part-2)

Wednesday, April 29, 2020, Steven Johnson, TeachOSM. (watch) Discussion around OpenStreetMap in education.

Wednesday, April 15, 2020, Erika Nunez, MapGive: U.S. Department of State’s public diplomacy initiative for open mapping

Thursday, April 9, 2020, Miles Campbell – (watch) OSM and Accessibility: In times of crisis, publicly available information for pedestrian access, especially for those with disabilities, can be invaluable

Wednesday, April 8, 2020 8pm ET, Virtual Validation Mappy Hour hosted by Missing Maps.

Wednesday, April 1, 2020 8:30pm ET / 5:30pm PT Maggie Cawley & Jennings Anderson, OpenStreetMap US Community Survey Results

What does social distancing look like? – A View from Space

A couple weeks ago Bloomberg News posted an interesting article (click here to read the article) showing how the stay at home orders are effecting areas around the world using high resolution satellite imagery. Below is an example showing Venice, Italy on October 20, 2019 compared to March 18, 2020 after the residents were asked to stay at home. It is interesting to compare the water clarity and traffic.

Venice, Italy: Notice the change in water traffic and water clarity after the Italy began ordering residents to stay at home. Source: Bloomberg.com

The article highlights numerous sites around the globe including: Wuhan, China (before shutdown / after shutdown); Mecca in Saudia Arabia; Venice, Italy; Epcot Center in Florida, USA; Tianjin, China; and Miami Beach, Florida, USA.

Resource: What It Looks Like From Space When Everything Stops, Eric Roston, March 24, 2020, Bloomberg.com

Additional COVID-19 GIS Mapping Resources for Iowa

Here are several more maps that are helpful for understanding the COVID-19 spread in Iowa.

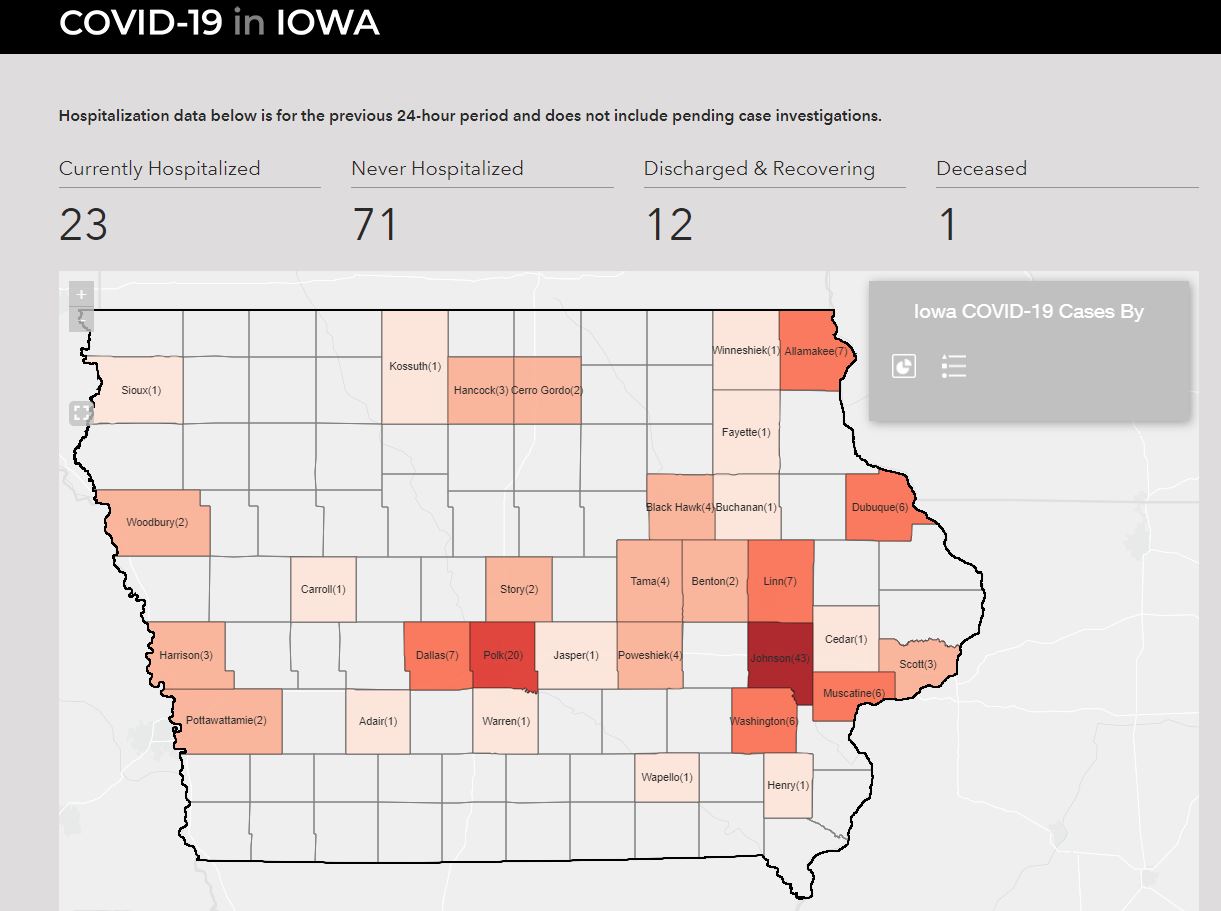
The State of Iowa has a COVID-19 page: https://coronavirus.iowa.gov/. There is a map of the the confirmed cases statewide. This page has demographic breakdown of the cases by male/female, age cohorts, as well as hospitalization and recovery information.

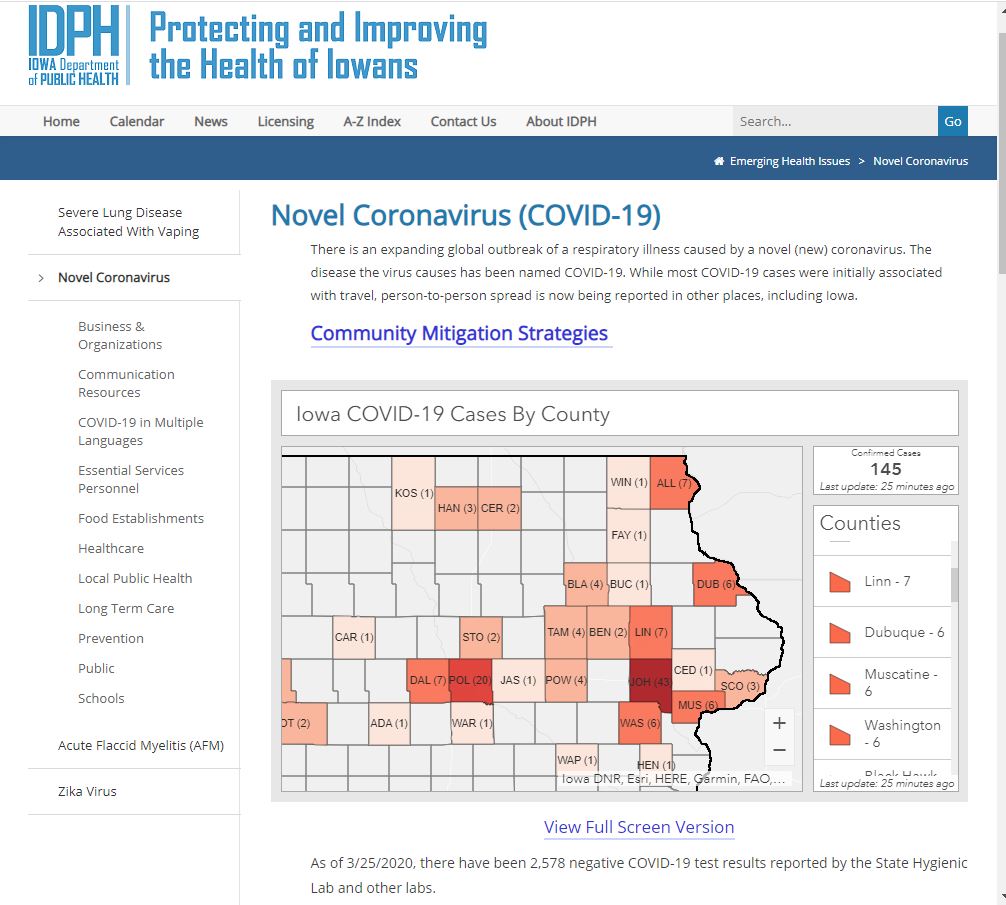
The Iowa Department of Public Health has a similar page: https://idph.iowa.gov/Emerging-Health-Issues/Novel-Coronavirus. One thing I like about the IDPH page is that they have the number of negative COVID-19 tests as well as the positive cases.


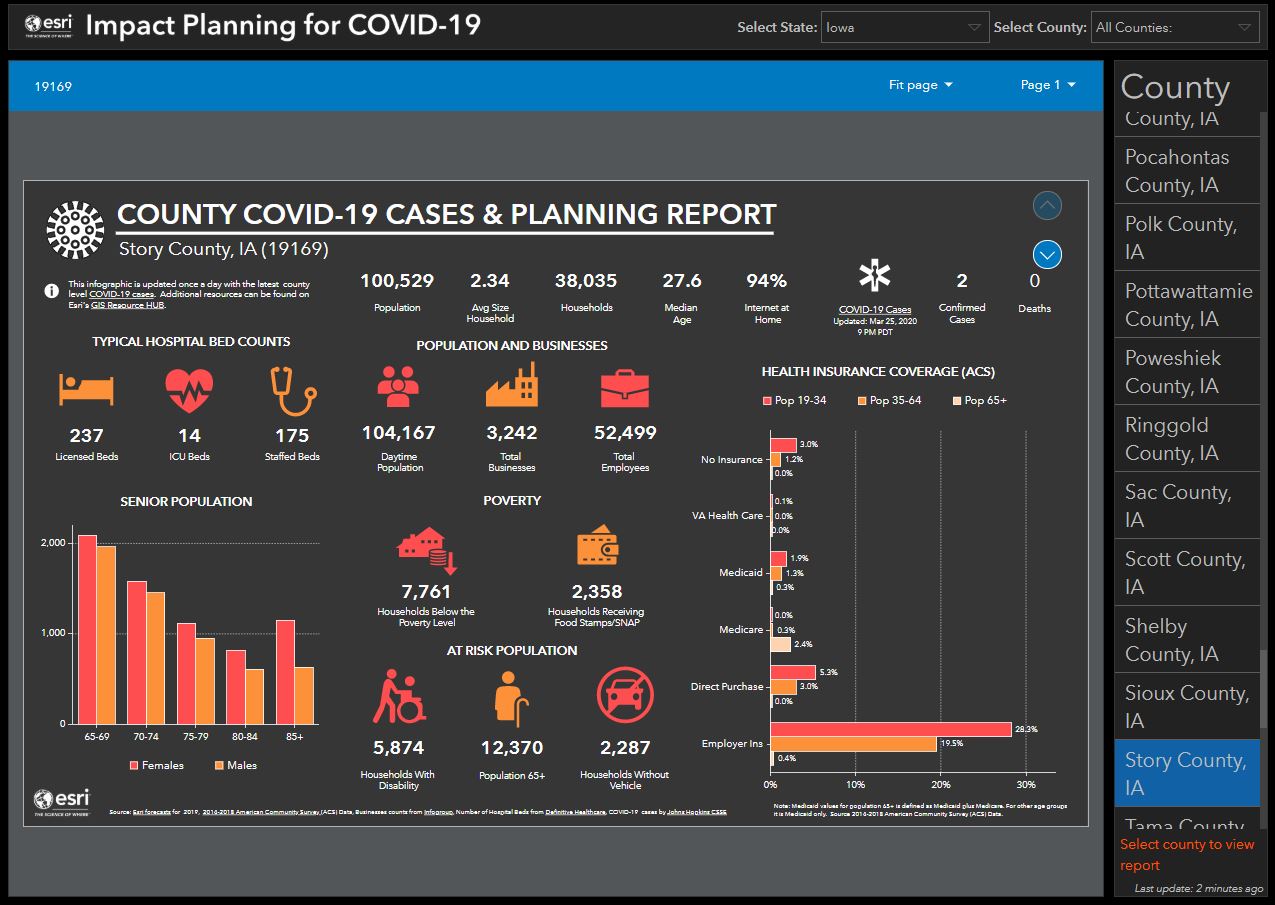
An interesting infographic site that is put out by ESRI called Impact Planning for COVID-19: https://business.maps.arcgis.com/apps/opsdashboard/index.html#/dc74772707d94db9a7d24d30ffdcf36c. This site pulls together demographic data, hospital data, insurance data to give a snap shot of each county around the country.

COVID-19 GIS Map Resources

The geospatial community has been doing a good job of mapping known COVID-19 cases. Having data in a map can often help us with decision making and help keep things in perspective.

ESRI has a COVID-19 GIS Hub which has a lot of great maps, data and applications.

Below are links to three maps that I have found useful:

– John Hopkins University has a map of global cases of the Coronavirus COVID-19 including data about confirmed cases, deaths, recovered, and active cases: https://www.arcgis.com/apps/opsdashboard/index.html#/bda7594740fd40299423467b48e9ecf6

– University of Washington has a more detailed map showing the “infection cases” in the United States. This map has descriptive information about the cases which I have found helpful in understanding more about how the virus and transmission. https://hgis.uw.edu/virus/

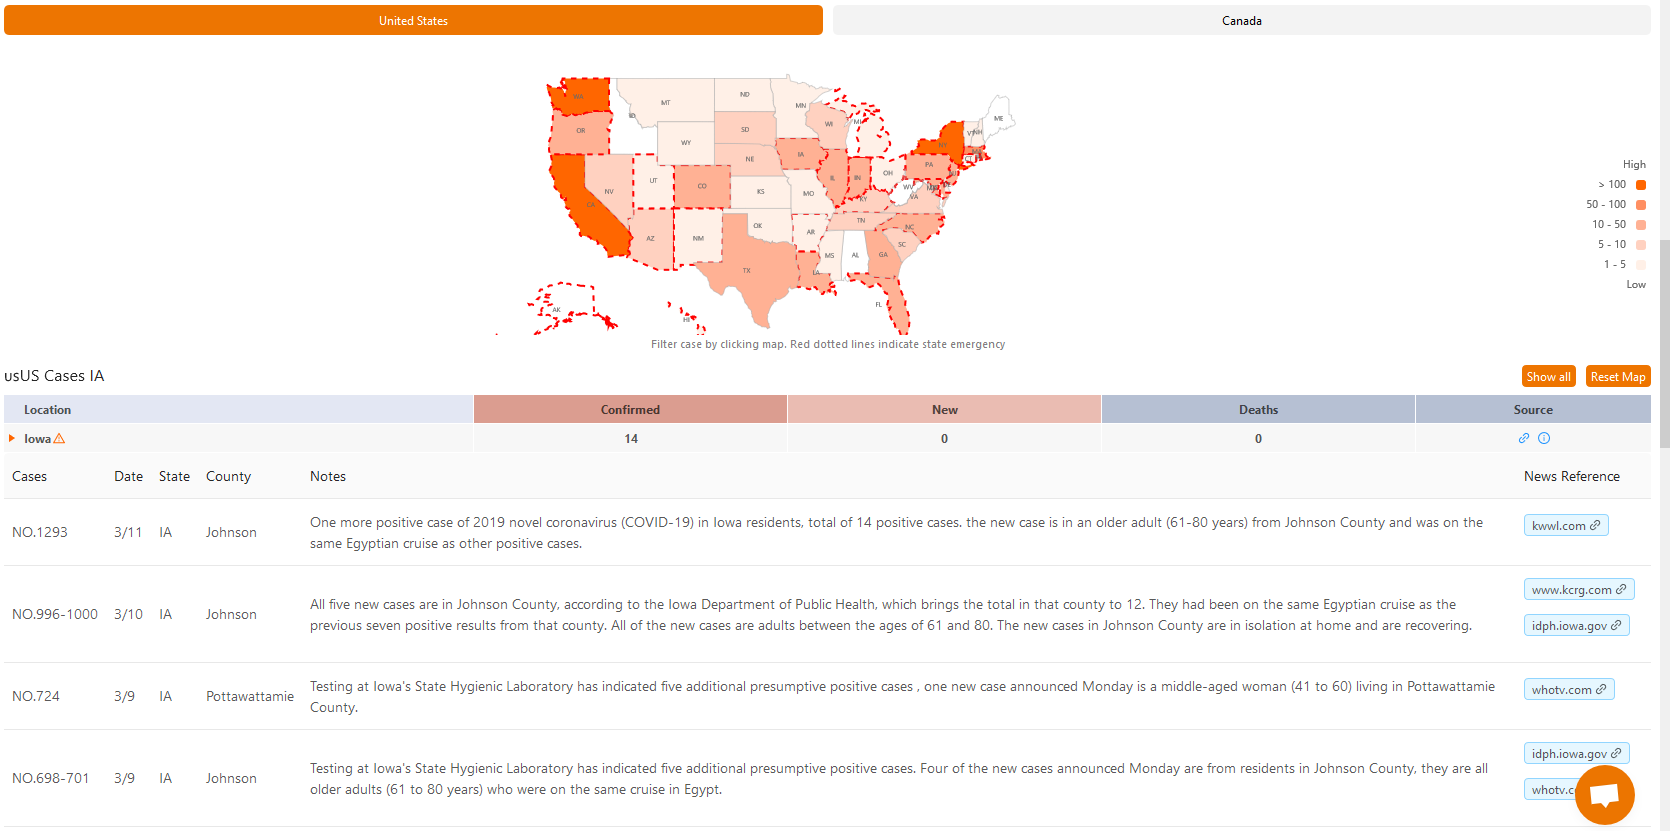
– Another map that I have found helpful was produced by 1point3acres, it provides details about each individual case and includes case number, date confirmed, county, and other case notes. https://coronavirus.1point3acres.com/en

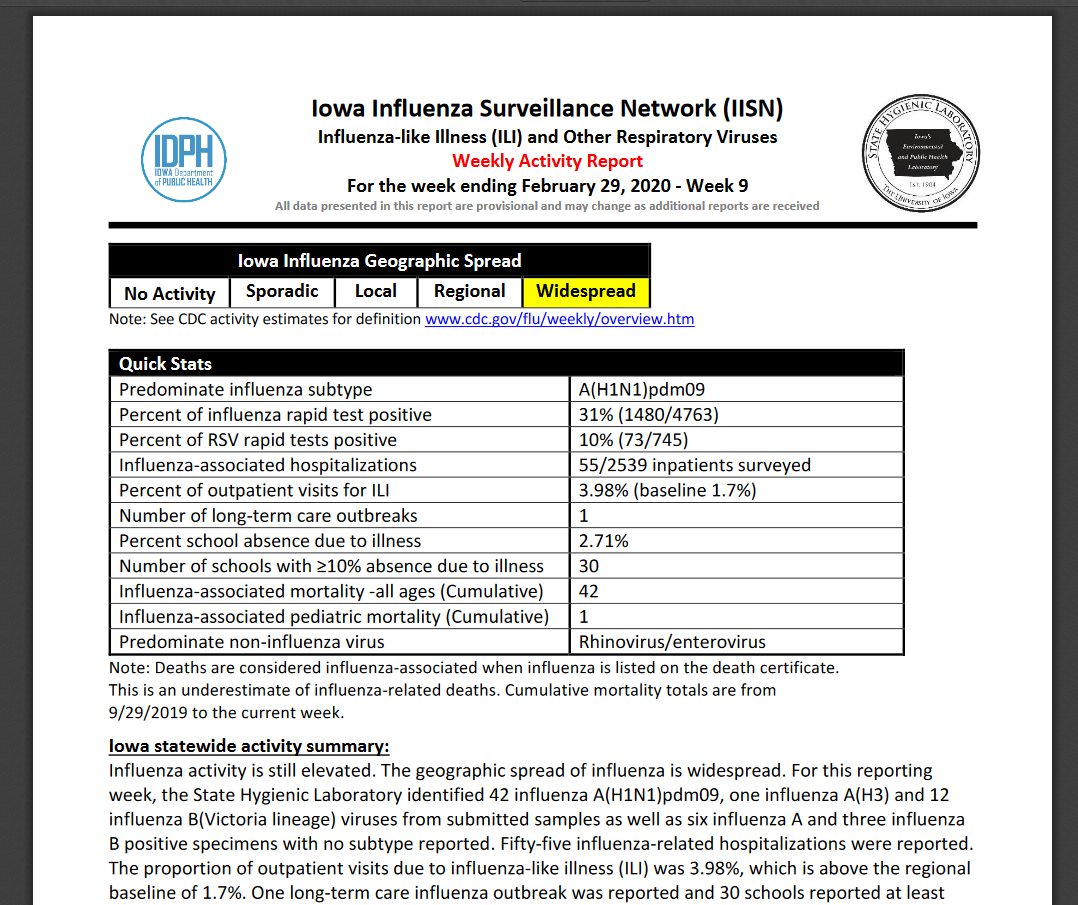
The Iowa Department of Public Health also produces a weekly Flu report (Iowa Influenza Surveillance Network) which gives very detailed information about the state of influenza-like illnesses across the state throughout the flu season. https://idph.iowa.gov/influenza/reports