In today’s lesson, we are examining water use and water quality. Satellite imagery helps scientists to better understand the changes in the environment. Examine the images below of the Aral Sea; the left image is from April 10, 1986, and the right image is from June 5, 2024. The water loss between the two images is striking. Once, the Aral Sea was the fourth-largest lake in the world; however, the Soviet Union diverted two major rivers to irrigate farmland (human water use), cutting off the inland sea from its water source in the 1960s.
What a difference 35 years can make!?!
Images from the lesson
We continue our odyssey, exploring the lessons of the 2024 Earth Observation Day poster, “Earth Science Everywhere.“ The lesson fulfills the NGSS MS-ESS3-3 standard. Students will examine how humans impact earth systems through water use and quality. Human activities can significantly alter the biosphere, sometimes damaging or destroying natural ecosystems. Changes to Earth’s environment can have different impacts (negative and positive) on other living things. Humans can perform activities and invent technologies to mitigate or prevent negative impacts on the Earth.
The Aral Sea is located in western Asia in the counties of Turkmenistan, Uzbekistan, and Kazakhstan.
After discussing the images, students will be asked to read an article from the NASA Earth Observatory website: “World of Change: Shrinking Aral Sea,” to learn more about what caused this water loss and view a time-lapse video of the shrinking sea. Next, students will have a chance to use Google Earth to investigate the shrinking of the Aral Sea with measurement tools and various years of imagery and create their own time-lapse videos as time permits. After that, as the lesson wraps up, students will learn about environmental protection careers. Finally, an online game or printable quiz is available to test students’ comprehension of the main topics of the lesson.
On May 18, 1980, Mount St. Helens erupted, causing widespread devastation across the surrounding landscape. An infrared, false-color image, captured on August 26, 1986, by the Thematic Mapper sensor on Landsat 5, vividly illustrates the eruption’s aftermath. The image reveals the extensive damage caused by the eruption, including the vast areas of barren land and the destruction of dense forests. Disaster mapping is crucial in understanding the long-term environmental impact of natural and human-made disasters. It also aids in monitoring the gradual environmental recovery process.
Image 1: What’s going on in this picture? An Image from the lesson plan
This lesson teaches students about natural hazards and disasters from a global scientific perspective and also to help bring awareness to the natural hazards at their local level. By having local knowledge about natural hazards students are better prepared as they make choices in their communities. In the first activity, students learn important vocabulary words. the words will help students understand the difference between a natural hazard (environmental phenomena that have the potential to impact societies and the human environment) and a natural disaster (the negative impact following an actual occurrence of a natural hazard in the event that it significantly harms a community.)
Then students will use Mt. St. Helens as a case study to examine these ideas. Students will look at a satellite image taken shortly after the Mt. St. Helens volcanic eruption and be asked to tell what is going on in the image (see Image 1). To help reinforce the vocabulary concepts students can play an online game or complete a print handout (see Image 4).
Image 2: A screenshot from the NASA Earth Observatory Page
Next, students will continue learning about Mt. St. Helens by completing a reading, “Devastation and Recovery at Mt. St. Helens,” on the NASA Earth Observatory website. They will also view a time-lapse video showing images from 1979-2016. Students can complete another short online quiz or printout to assess reading comprehension. To wrap up the Mt. St. Helens lesson, students will spend time usingGoogle Earth to explore the site of the volcano’s eruption. The teacher is encouraged to discuss how satellite imagery has been a major technological breakthrough for disaster management. It has allowed scientists a new way to monitor changes, which helps track hazards and disasters. Example: images before the eruption, in the aftermath (to assess the damage), and in the recovery phase. Share with students that the Landsat satellite has a new image every 16 days.
Transitioning to the second part of the lesson which is focused on identifying the most significant risks of natural disasters locally based on the local occurrence of natural hazards. It is important to emphasize that natural hazards can occur in any region of the country. While we can’t stop natural hazards from occurring, we can do our best to be prepared for them when they do occur.
One way we can be prepared for natural hazards is to know the greatest risks in our local community. The Federal Emergency Management Agency (FEMA) defines natural hazards as environmental phenomena that have the potential to impact societies and the human environment. FEMA created a web map of the United States that scores every location based on their risk of natural hazards and their community’s resiliency. The FEMA National Risk Index Map can help communities understand their natural hazard risks and their expected impacts during or after a disaster.
Image 3: The user interface of the FEMA National Risk Index Tool
Therefore, to better understand these risks, students will learn about 18 common natural hazards, and then they will estimate which hazards they think are most likely to happen in your community. After talking with a partner and the class, students will be introduced to the FEMA National Risk Index website; please take a look at the lesson plan for more details. As the class wraps up, there will be a short discussion of emergency management careers. A final online game or printable quiz is available to test students’ natural hazards knowledge from the lesson.
Scientists have been using satellite imagery to track the deforestation of the Amazon rainforest for several decades. The clearing of the rainforest has changed over time, both in its pace and its location. For two decades, beginning in the 1990s, agriculture, forestry, and mining development proceeded rapidly. Satellite-based forest monitoring has enabled successful enforcement of forestry management practices, where such practices are applied. The Landsat image pair on the front of the Earth Observation Day poster shows the change in land use that occurred between 2001 and 2019, when palm oil plantations replaced rainforest in Peru. Illegal forest clearing is constantly adapting to new monitoring practices, and is still occurring across the region. Satellite imagery helps scientists and governments to monitor shifts in deforestation and develop new deterrence strategies.
Image 1: What’s going on in these pictures? Images from the lesson plan
This is a great lesson for teaching students how satellite images can show the impact deforestation can have on a community. The lesson is broken into two sessions. The first session is focused on engaging students with satellite imagery. The first exercise asks students to look at two images and explain what is going on (see Image 1). The images are showing the landscape change associated with rainforest deforestation. Next students get to use the Landsat App, an online browser based tool (seen in Image 2), to complete a lab exercise to notice change in the Amazon rainforest of Brazil in Ariquemas over a forty-year period. Finally, to end the first session, students will use their new knowledge about satellite imagery to put a series of images in order on a timeline.
In the second session, students read an article about Amazon deforestation. Reading the article brings further meaning to the lab and image analysis that the students did in session one. Next, students have an opportunity to explore careers related to forestry and environmental planning. To wrap up the lesson, students take a quiz about Amazon deforestation related to the previous activities. This powerful lesson illustrates the importance of having access to the US Landsat satellite imagery program, a free, expansive (over 50 years), historical and ongoing record that helps scientists and government officials monitor deforestation and help guide policymaking to preserve natural resources.
Did you know that in 2024 members the AmericaView Education and Outreach Team put together a series of lessons explaining how remote sensing and Earth observation technologies are integral to various sectors within society? These lessons are great! They are geared for middle and high school but can be adapted for your classroom. All six lessons follow a similar pattern: introduction, standards, warm-up (What’s going on in this picture?), a reading exercise, an online map exploration, a career exploration related to the topic, a quiz/assessment, and an online/printable game.
Over the next few months, we will be taking time on the blog to dig into these lessons. We hope you enjoy unpacking these lessons and learn more about earth observation and remote sensing. If you have any questions or suggestions for new lessons, feel free to email IowaView Coordinator, Amy Logan or leave a comment.
Earlier this year, IowaView Staff member, Amy Logan, created a new piece of art for IowaView’s Iowa as Art Collection. The piece is called Cautionary Waters. It is based off an IowaView blog post, Change Over Time – Flooding on the Landscape (NW Iowa), a series of IowaShots images that were released in 2022. This piece revisits those images and includes new Landsat images from the 2023 drought and 2024 flood.
Cautionary Waters: Visons of the Past, Planning for the Future
How are we planning for the future in our communities? Cautionary Waters is a piece of artwork that asks us to think about this question.
The piece includes four Landsat satellite images of the same area of Northwest Iowa taken in 1990 (a normal year, upper left), 1993 (a year of memorable flooding in the Midwest, upper right), 2023 (a year of drought, lower left), and 2024 (another year of memorable flooding, lower right). White areas in these images are water. These two flood events were roughly 30 years apart.
The piece asks viewers to reflect: when we are planning, do we consider only typical conditions, or does our planning account for extremes, flood or drought as well? Are we willing to allow development in the floodplain and take the loss when the flood comes, or perhaps make a harder choice to not develop there and lose out in the short-term? Also, in cases when we choose to develop in lower elevation areas, what kinds of zoning and development are we allowing in these areas?
The piece is currently on display as part of the “Do Justice” art exhibit at Harvest Vineyard Church, in Ames, Iowa, which runs through the end of January 2025. After that the piece is available for loan on a first come, first serve basis. If interested in displaying the piece or other Iowa as Art pieces, please contact, Amy Logan, IowaView State Coordinator for additional details.
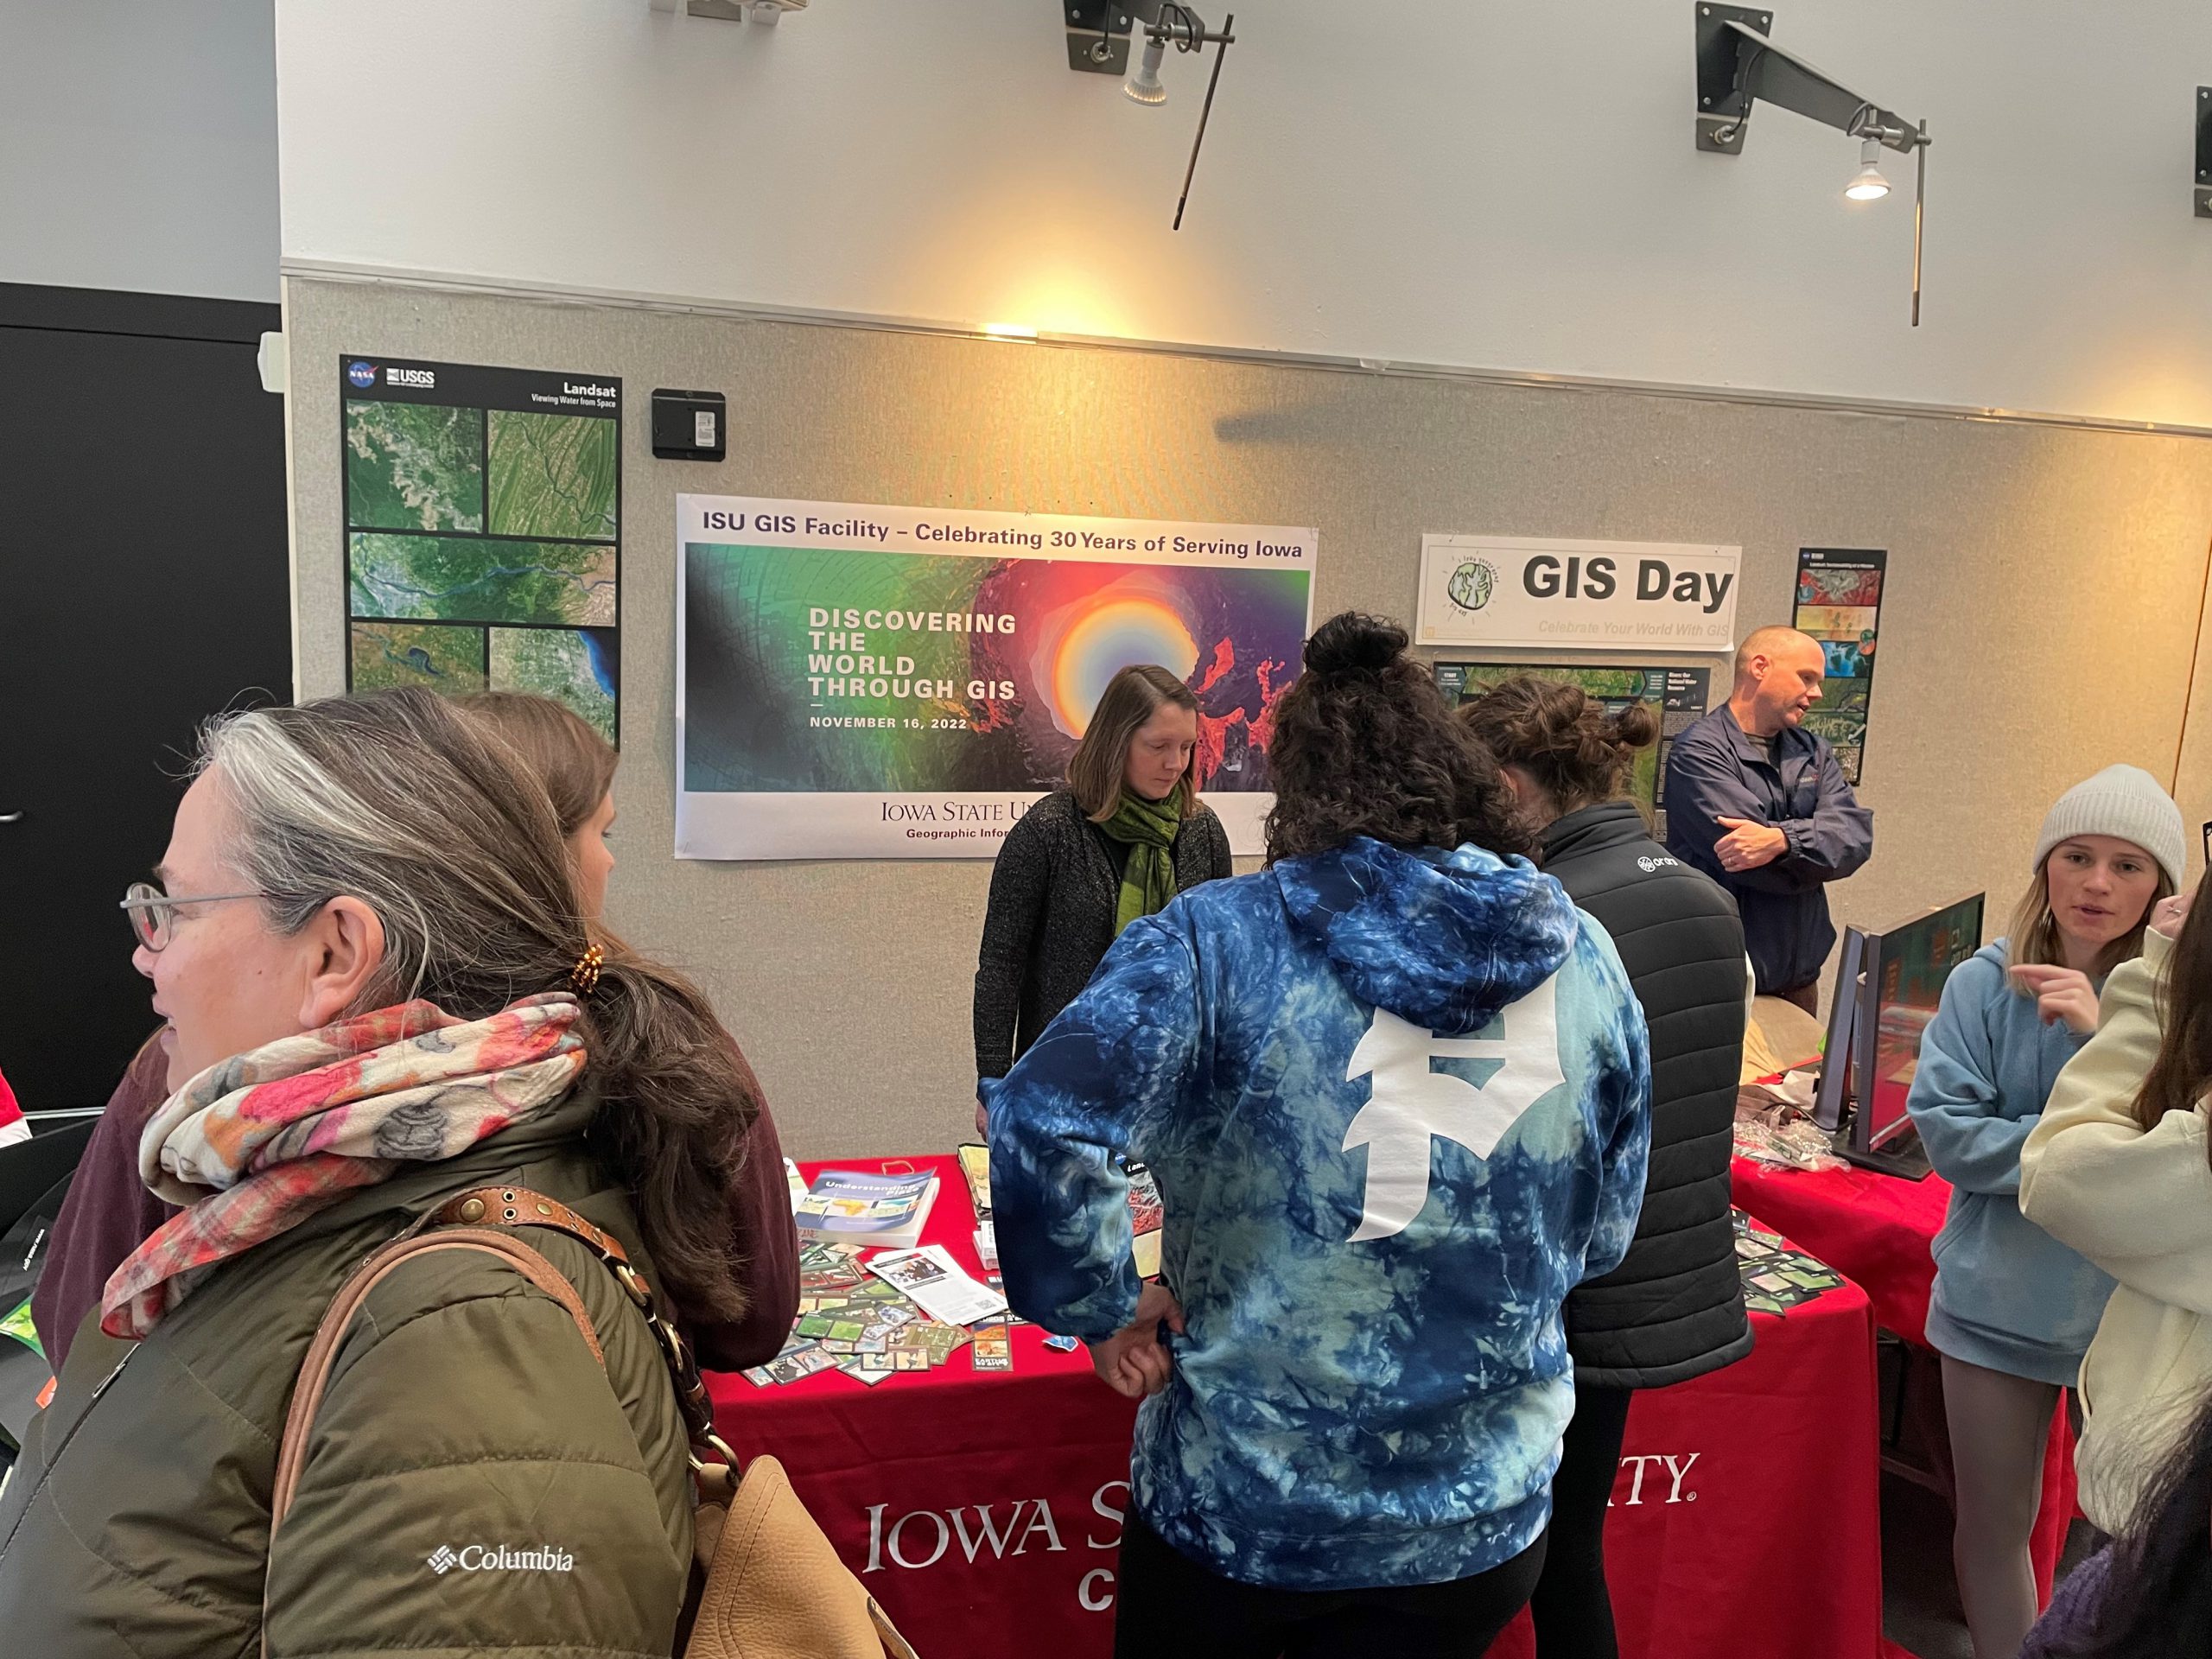
Celebrating 30 years of GIS at ISU today on GIS Day! We also celebrated the 50th anniversary of Landsat and were able to hand out playing cards, refreshments, posters, and other educational materials. This was a great opportunity for our staff in the GIS facility to share the work that they are doing, and teach others about GIS.
Today is GIS Day! We are celebrating in the North atrium of the College of Design. Today is an especially exciting celebration as we are also celebrating the 30th anniversary of the ISU GIS Facility on campus and 50 years of the US Landsat, earth observing satellite mission. Please join us in the College of Design from 11:30am to 2:00 pm. We will have several activities, puzzles, refreshments, educational giveaways, and door prizes.
Wednesday, November 16, 2022, the Iowa State University GIS Facility will be hosting an open house event for GIS Day from 11:30 to 2:00 in the North atrium of the College of Design.
This year we will also be celebrating the 30th anniversary of the ISU GIS Facility and 50 years of Landsat, the US Land Satellite mission. We will have refreshments and giveaways. It will be a chance for students interested in the GIS minor and GIS certificate programs to ask questions and to meet with GIS professionals. We have confirmed professionals from the Iowa Department of Transportation coming to showcase some of their work. If other GIS professionals are interested in reserving time to meet with students, please contact Amy Logan.
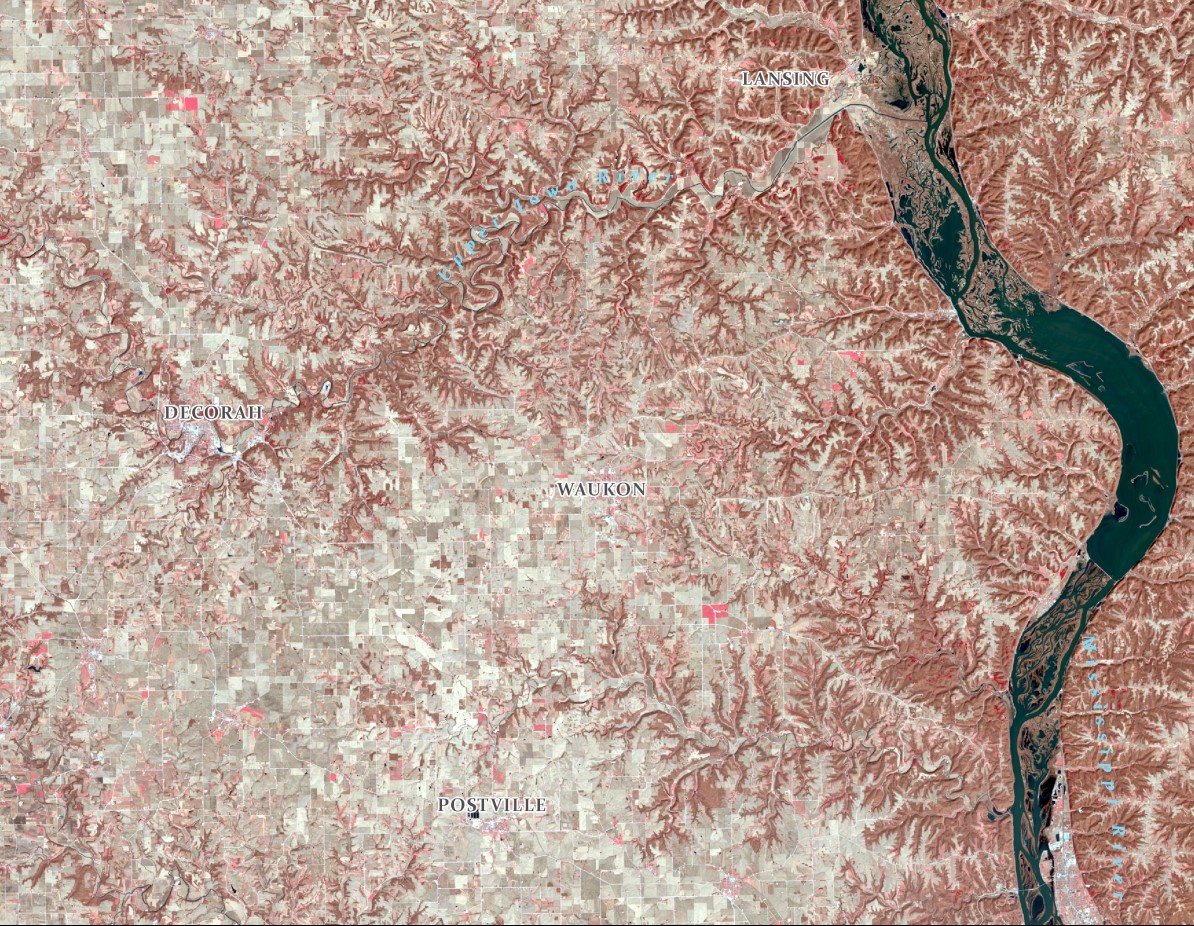
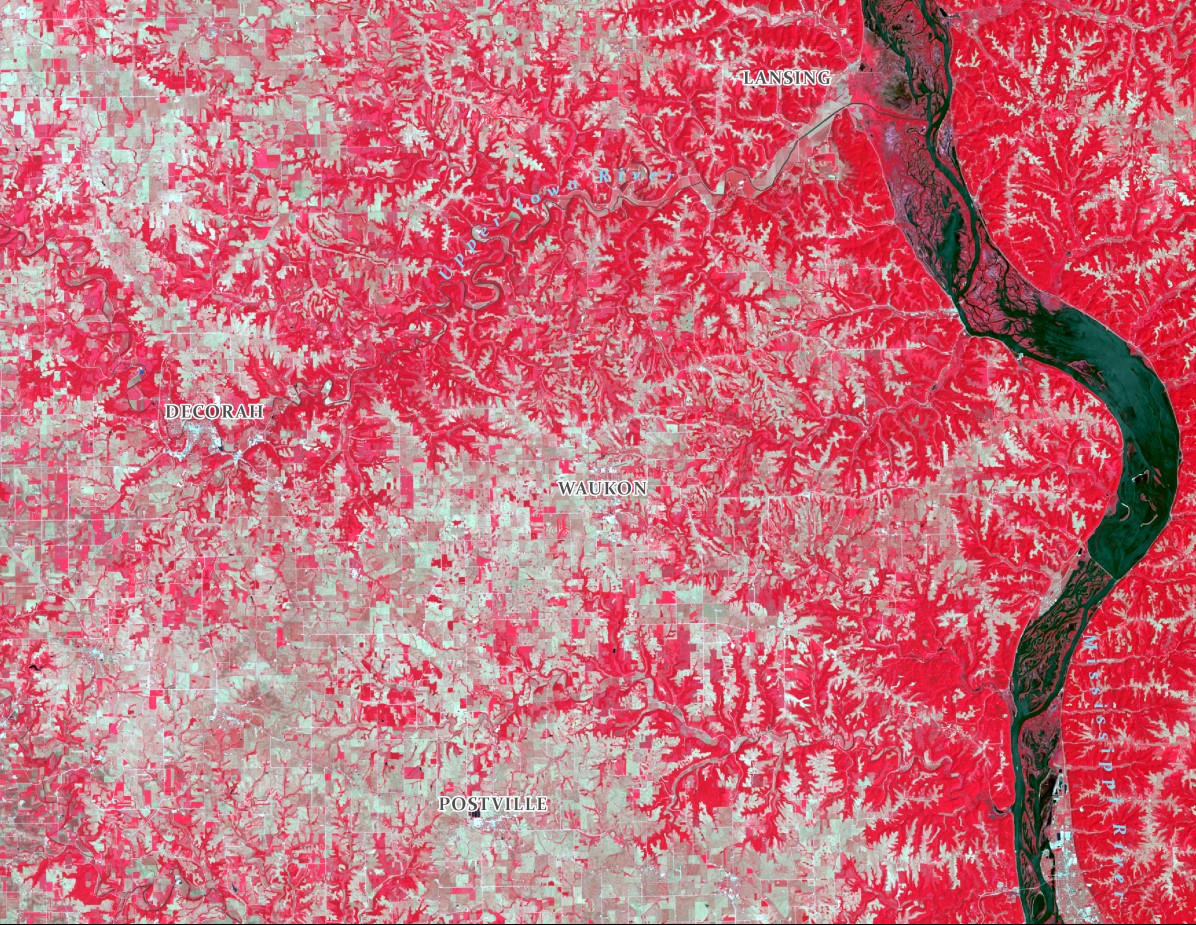
Happy Fall! Observe the changes across the landscape in seasonal images in Northeast Iowa. Snow, forest, farmland. Can you notice the areas of coniferous trees versus deciduous trees and where there is seasonal farmland compared to pasture areas? Also notice the changes along the Mississippi and Upper Iowa Rivers. Enjoy the changing seasons!
This year we are celebrating 50 years of the Landsat earth observing satellite mission. Landsat data helps us observe changes in our communities and environment over time.