Annually, the United Nations celebrates March 22nd as World Water Day. World Water Day celebrates water and raises awareness of the 2.2 billion people living without access to safe water. The day is about taking action to tackle the global water crisis, and remembering what a vital role water plays for all of humanity. This year, the theme of World Water Day is “SAVE OUR GLACIERS,” with a focus on glacier preservation. Therefore, no matter where we live, glaciers are critical to our water future.
“I don’t live near a glacier. Why should I care about glaciers?”
Glacier Facts: 70% of the Earth’s fresh water exists as snow or ice. Around 10% of the Earth’s land area is covered by glaciers or ice sheets.
Glaciers are part of the “cryosphere” which impacts every living being on the planet. The word “cryosphere” originates from the Greek word ‘kryos’ for frost or ice cold. The cryosphere extends across the globe and can appear seasonally (like snow in Iowa) or be permanently present in most parts of the world. The snow, glacier, permafrost, and frozen ground are significant storage and sources of freshwater, sustaining ecosystems and supporting livelihoods in and far beyond the regions where these are located. While you watch the video below you will learn about the cryosphere and how it’s changing.
Undeniably, all living beings depend directly or indirectly on the cryosphere. For example, as all major rivers originate from mountains, the mountain cryosphere plays an important role in providing and regulating freshwater resources for around half of the world’s population. Furthermore, alterations and loss of critical snow and ice are increasing the risk of other hazards.
The state of cryosphere is also a useful indicator for climate variability and change. Therefore, improved monitoring is critical to understand Earth’s weather, climate, and water cycles. The cryosphere, its changes, and its impacts have received increased attention in recent years, creating a demand for authoritative information on the state of the world’s snow and ice resources.
As shown above in the video, glaciers are extremely important to help regulate the earth’s temperature. Glaciers, snow, and ice reflect much of the sun’s radiation into space (keeping those areas cooler), unlike the bare ground or open ocean water, which absorb the radiation (making them warmer). Glaciers also store freshwater and are an essential part of the water cycle.
In today’s lesson, we are examining water use and water quality. Satellite imagery helps scientists to better understand the changes in the environment. Examine the images below of the Aral Sea; the left image is from April 10, 1986, and the right image is from June 5, 2024. The water loss between the two images is striking. Once, the Aral Sea was the fourth-largest lake in the world; however, the Soviet Union diverted two major rivers to irrigate farmland (human water use), cutting off the inland sea from its water source in the 1960s.
What a difference 35 years can make!?!
Images from the lesson
We continue our odyssey, exploring the lessons of the 2024 Earth Observation Day poster, “Earth Science Everywhere.“ The lesson fulfills the NGSS MS-ESS3-3 standard. Students will examine how humans impact earth systems through water use and quality. Human activities can significantly alter the biosphere, sometimes damaging or destroying natural ecosystems. Changes to Earth’s environment can have different impacts (negative and positive) on other living things. Humans can perform activities and invent technologies to mitigate or prevent negative impacts on the Earth.
The Aral Sea is located in western Asia in the counties of Turkmenistan, Uzbekistan, and Kazakhstan.
After discussing the images, students will be asked to read an article from the NASA Earth Observatory website: “World of Change: Shrinking Aral Sea,” to learn more about what caused this water loss and view a time-lapse video of the shrinking sea. Next, students will have a chance to use Google Earth to investigate the shrinking of the Aral Sea with measurement tools and various years of imagery and create their own time-lapse videos as time permits. After that, as the lesson wraps up, students will learn about environmental protection careers. Finally, an online game or printable quiz is available to test students’ comprehension of the main topics of the lesson.
On May 18, 1980, Mount St. Helens erupted, causing widespread devastation across the surrounding landscape. An infrared, false-color image, captured on August 26, 1986, by the Thematic Mapper sensor on Landsat 5, vividly illustrates the eruption’s aftermath. The image reveals the extensive damage caused by the eruption, including the vast areas of barren land and the destruction of dense forests. Disaster mapping is crucial in understanding the long-term environmental impact of natural and human-made disasters. It also aids in monitoring the gradual environmental recovery process.
Image 1: What’s going on in this picture? An Image from the lesson plan
This lesson teaches students about natural hazards and disasters from a global scientific perspective and also to help bring awareness to the natural hazards at their local level. By having local knowledge about natural hazards students are better prepared as they make choices in their communities. In the first activity, students learn important vocabulary words. the words will help students understand the difference between a natural hazard (environmental phenomena that have the potential to impact societies and the human environment) and a natural disaster (the negative impact following an actual occurrence of a natural hazard in the event that it significantly harms a community.)
Then students will use Mt. St. Helens as a case study to examine these ideas. Students will look at a satellite image taken shortly after the Mt. St. Helens volcanic eruption and be asked to tell what is going on in the image (see Image 1). To help reinforce the vocabulary concepts students can play an online game or complete a print handout (see Image 4).
Image 2: A screenshot from the NASA Earth Observatory Page
Next, students will continue learning about Mt. St. Helens by completing a reading, “Devastation and Recovery at Mt. St. Helens,” on the NASA Earth Observatory website. They will also view a time-lapse video showing images from 1979-2016. Students can complete another short online quiz or printout to assess reading comprehension. To wrap up the Mt. St. Helens lesson, students will spend time usingGoogle Earth to explore the site of the volcano’s eruption. The teacher is encouraged to discuss how satellite imagery has been a major technological breakthrough for disaster management. It has allowed scientists a new way to monitor changes, which helps track hazards and disasters. Example: images before the eruption, in the aftermath (to assess the damage), and in the recovery phase. Share with students that the Landsat satellite has a new image every 16 days.
Transitioning to the second part of the lesson which is focused on identifying the most significant risks of natural disasters locally based on the local occurrence of natural hazards. It is important to emphasize that natural hazards can occur in any region of the country. While we can’t stop natural hazards from occurring, we can do our best to be prepared for them when they do occur.
One way we can be prepared for natural hazards is to know the greatest risks in our local community. The Federal Emergency Management Agency (FEMA) defines natural hazards as environmental phenomena that have the potential to impact societies and the human environment. FEMA created a web map of the United States that scores every location based on their risk of natural hazards and their community’s resiliency. The FEMA National Risk Index Map can help communities understand their natural hazard risks and their expected impacts during or after a disaster.
Image 3: The user interface of the FEMA National Risk Index Tool
Therefore, to better understand these risks, students will learn about 18 common natural hazards, and then they will estimate which hazards they think are most likely to happen in your community. After talking with a partner and the class, students will be introduced to the FEMA National Risk Index website; please take a look at the lesson plan for more details. As the class wraps up, there will be a short discussion of emergency management careers. A final online game or printable quiz is available to test students’ natural hazards knowledge from the lesson.
Scientists have been using satellite imagery to track the deforestation of the Amazon rainforest for several decades. The clearing of the rainforest has changed over time, both in its pace and its location. For two decades, beginning in the 1990s, agriculture, forestry, and mining development proceeded rapidly. Satellite-based forest monitoring has enabled successful enforcement of forestry management practices, where such practices are applied. The Landsat image pair on the front of the Earth Observation Day poster shows the change in land use that occurred between 2001 and 2019, when palm oil plantations replaced rainforest in Peru. Illegal forest clearing is constantly adapting to new monitoring practices, and is still occurring across the region. Satellite imagery helps scientists and governments to monitor shifts in deforestation and develop new deterrence strategies.
Image 1: What’s going on in these pictures? Images from the lesson plan
This is a great lesson for teaching students how satellite images can show the impact deforestation can have on a community. The lesson is broken into two sessions. The first session is focused on engaging students with satellite imagery. The first exercise asks students to look at two images and explain what is going on (see Image 1). The images are showing the landscape change associated with rainforest deforestation. Next students get to use the Landsat App, an online browser based tool (seen in Image 2), to complete a lab exercise to notice change in the Amazon rainforest of Brazil in Ariquemas over a forty-year period. Finally, to end the first session, students will use their new knowledge about satellite imagery to put a series of images in order on a timeline.
In the second session, students read an article about Amazon deforestation. Reading the article brings further meaning to the lab and image analysis that the students did in session one. Next, students have an opportunity to explore careers related to forestry and environmental planning. To wrap up the lesson, students take a quiz about Amazon deforestation related to the previous activities. This powerful lesson illustrates the importance of having access to the US Landsat satellite imagery program, a free, expansive (over 50 years), historical and ongoing record that helps scientists and government officials monitor deforestation and help guide policymaking to preserve natural resources.
Ready, set, go! As promised in our previous post we are going to do an overview of the recently published AmericaView lesson plans. The first lesson from the 2024 Earth Observation Day lesson series is, “Exploring the Electromagnetic Spectrum (EMS).” This lesson is intended to be an introductory lesson to help give students a basic understanding of the electromagnetic spectrum, energy waves, and remote sensing. Students will gain background knowledge and learn vocabulary from this lesson to help them as they move through other lessons that are focused on specific disciplines. The lesson is broken into two sessions.
The first session has 4 activities. First, an introductory video explaining electromagnetic radiation, electromagnetic waves, and visible light. Second, a reading activity called “Anatomy of an Electromagnetic Wave” to reinforce concepts from the video. Third student examine two diagrams, one displaying energy waves across the EMS and a second diagram showing a timeline and introduction to the US Landsat Mission which has been tasked with collecting earth data across the EMS since 1972. The final activity is a physical activity using a jump rope to further demonstrate concepts of energy waves (frequency, wavelength, energy).
The second session’s activities include a warm-up that is examining a satellite image to identify various features. Next there are two readings, “Wave behaviors,” which explores different vocabulary related to EMS waves, and “Visualization: from Energy to Image,” which explains how invisible EMS waves are converted into different forms of imagery. Next, students get to apply knowledge in “Exploring Remote Sensing Activity.” They will get to explore how different surfaces emit different light energy. Students will also get a chance to explore remote sensing using Google Earth. Finally, to wrap up this lesson, students will wrap up this session with a quiz style game or a printable quiz.
Did you know that in 2024 members the AmericaView Education and Outreach Team put together a series of lessons explaining how remote sensing and Earth observation technologies are integral to various sectors within society? These lessons are great! They are geared for middle and high school but can be adapted for your classroom. All six lessons follow a similar pattern: introduction, standards, warm-up (What’s going on in this picture?), a reading exercise, an online map exploration, a career exploration related to the topic, a quiz/assessment, and an online/printable game.
Over the next few months, we will be taking time on the blog to dig into these lessons. We hope you enjoy unpacking these lessons and learn more about earth observation and remote sensing. If you have any questions or suggestions for new lessons, feel free to email IowaView Coordinator, Amy Logan or leave a comment.
Earth Observation Day 2024 is finally here as it the release of the AmericaView 2024 Earth Observation Day Poster! The poster is following the theme of this year’s Earth Science Week theme, “Earth Science Everywhere”. The front of the AmericaView 2024 Earth Observation Day poster features 6 image themes: agriculture, disaster, forestry, urban land use, water, and wildlife. The back of the poster explains the significance of the images and provides links to 6 themed lesson plans. IowaView was responsible for the disaster management lesson plan.
The ISU GIS Facility will be hosting the 3rd annual geospatial summer workshop for K-12 teachers and pre-service teachers in Ames, Iowa on July 17 – 18, 2024. This workshop will show many geospatial tools and applications from the Esri ecosystem as well as Google Earth, OpenStreetMap, AmericaView, and others. Teachers will get to see a variety of map tools and exercises that they can bring into current lessons. We will explore resources available at local, state, and national levels. Each participant will make a StoryMap to use in their classroom. Teachers can sign up for graduate or continuing education credit. Please email Amy Logan with any questions.
A StoryMap developed by Mary Schorse and Tracy DeLiberty (DelawareView)
Have you ever thought about how much water it takes to make a pair of jeans? To produce a pound of corn? Or to make a car? What if you had a limited amount of water and had to decide how to “spend” your precious resource? Water: A Global Resource is an ArcGIS StoryMap, developed by Mary Schorse and Tracy DeLiberty (DelawareView), is designed to give you background on what we mean by ‘water resources.’ The lessons are also designed to stimulate your thinking about how we use, protect and monitor this precious, limited natural resource.
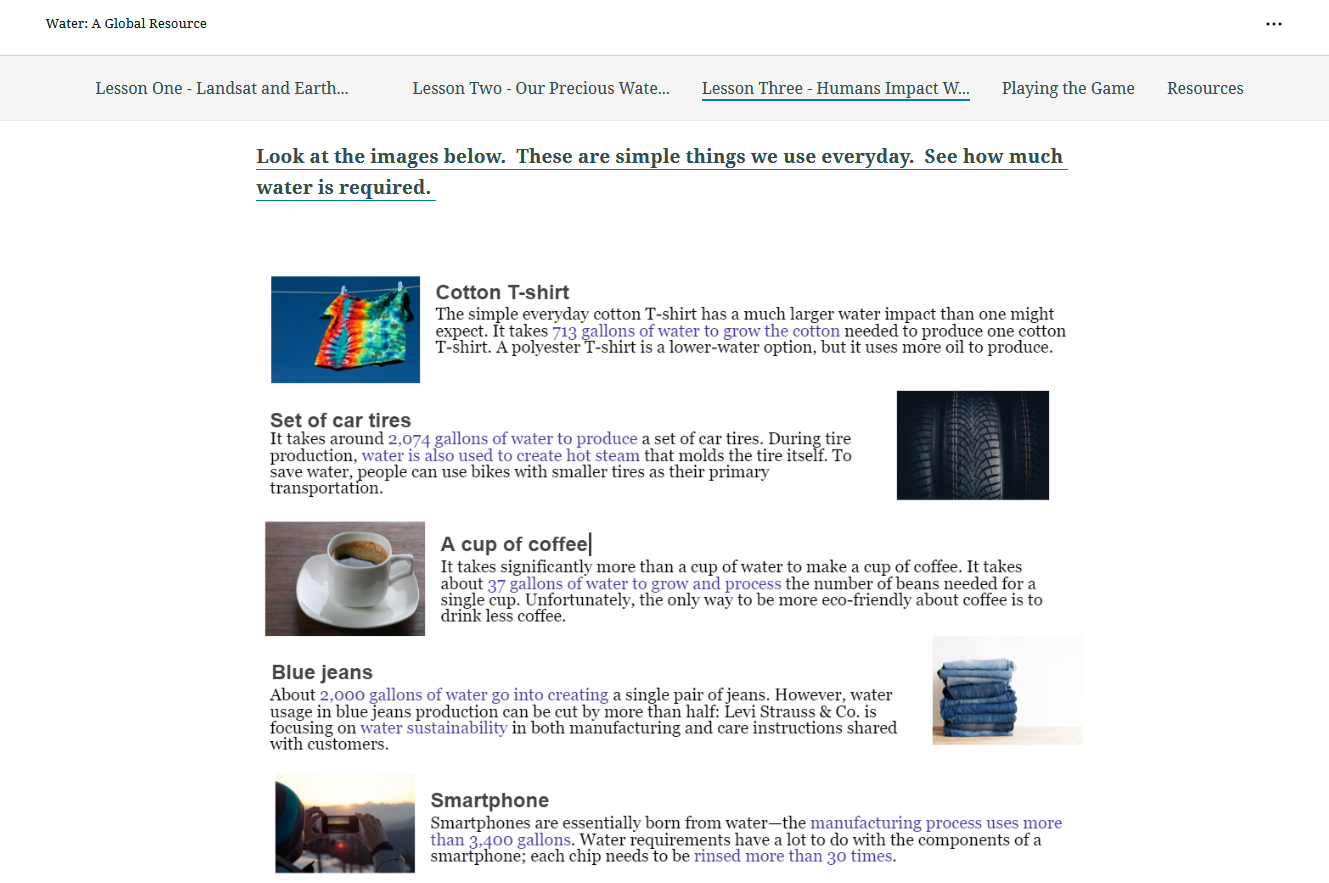
Screen shot from the Water: A Global Resource StoryMap
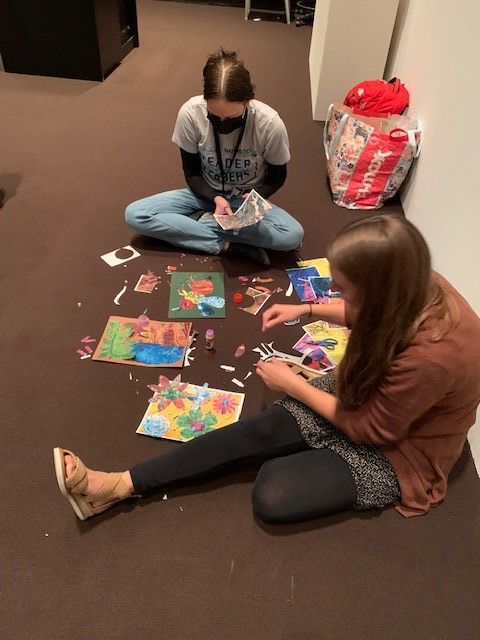
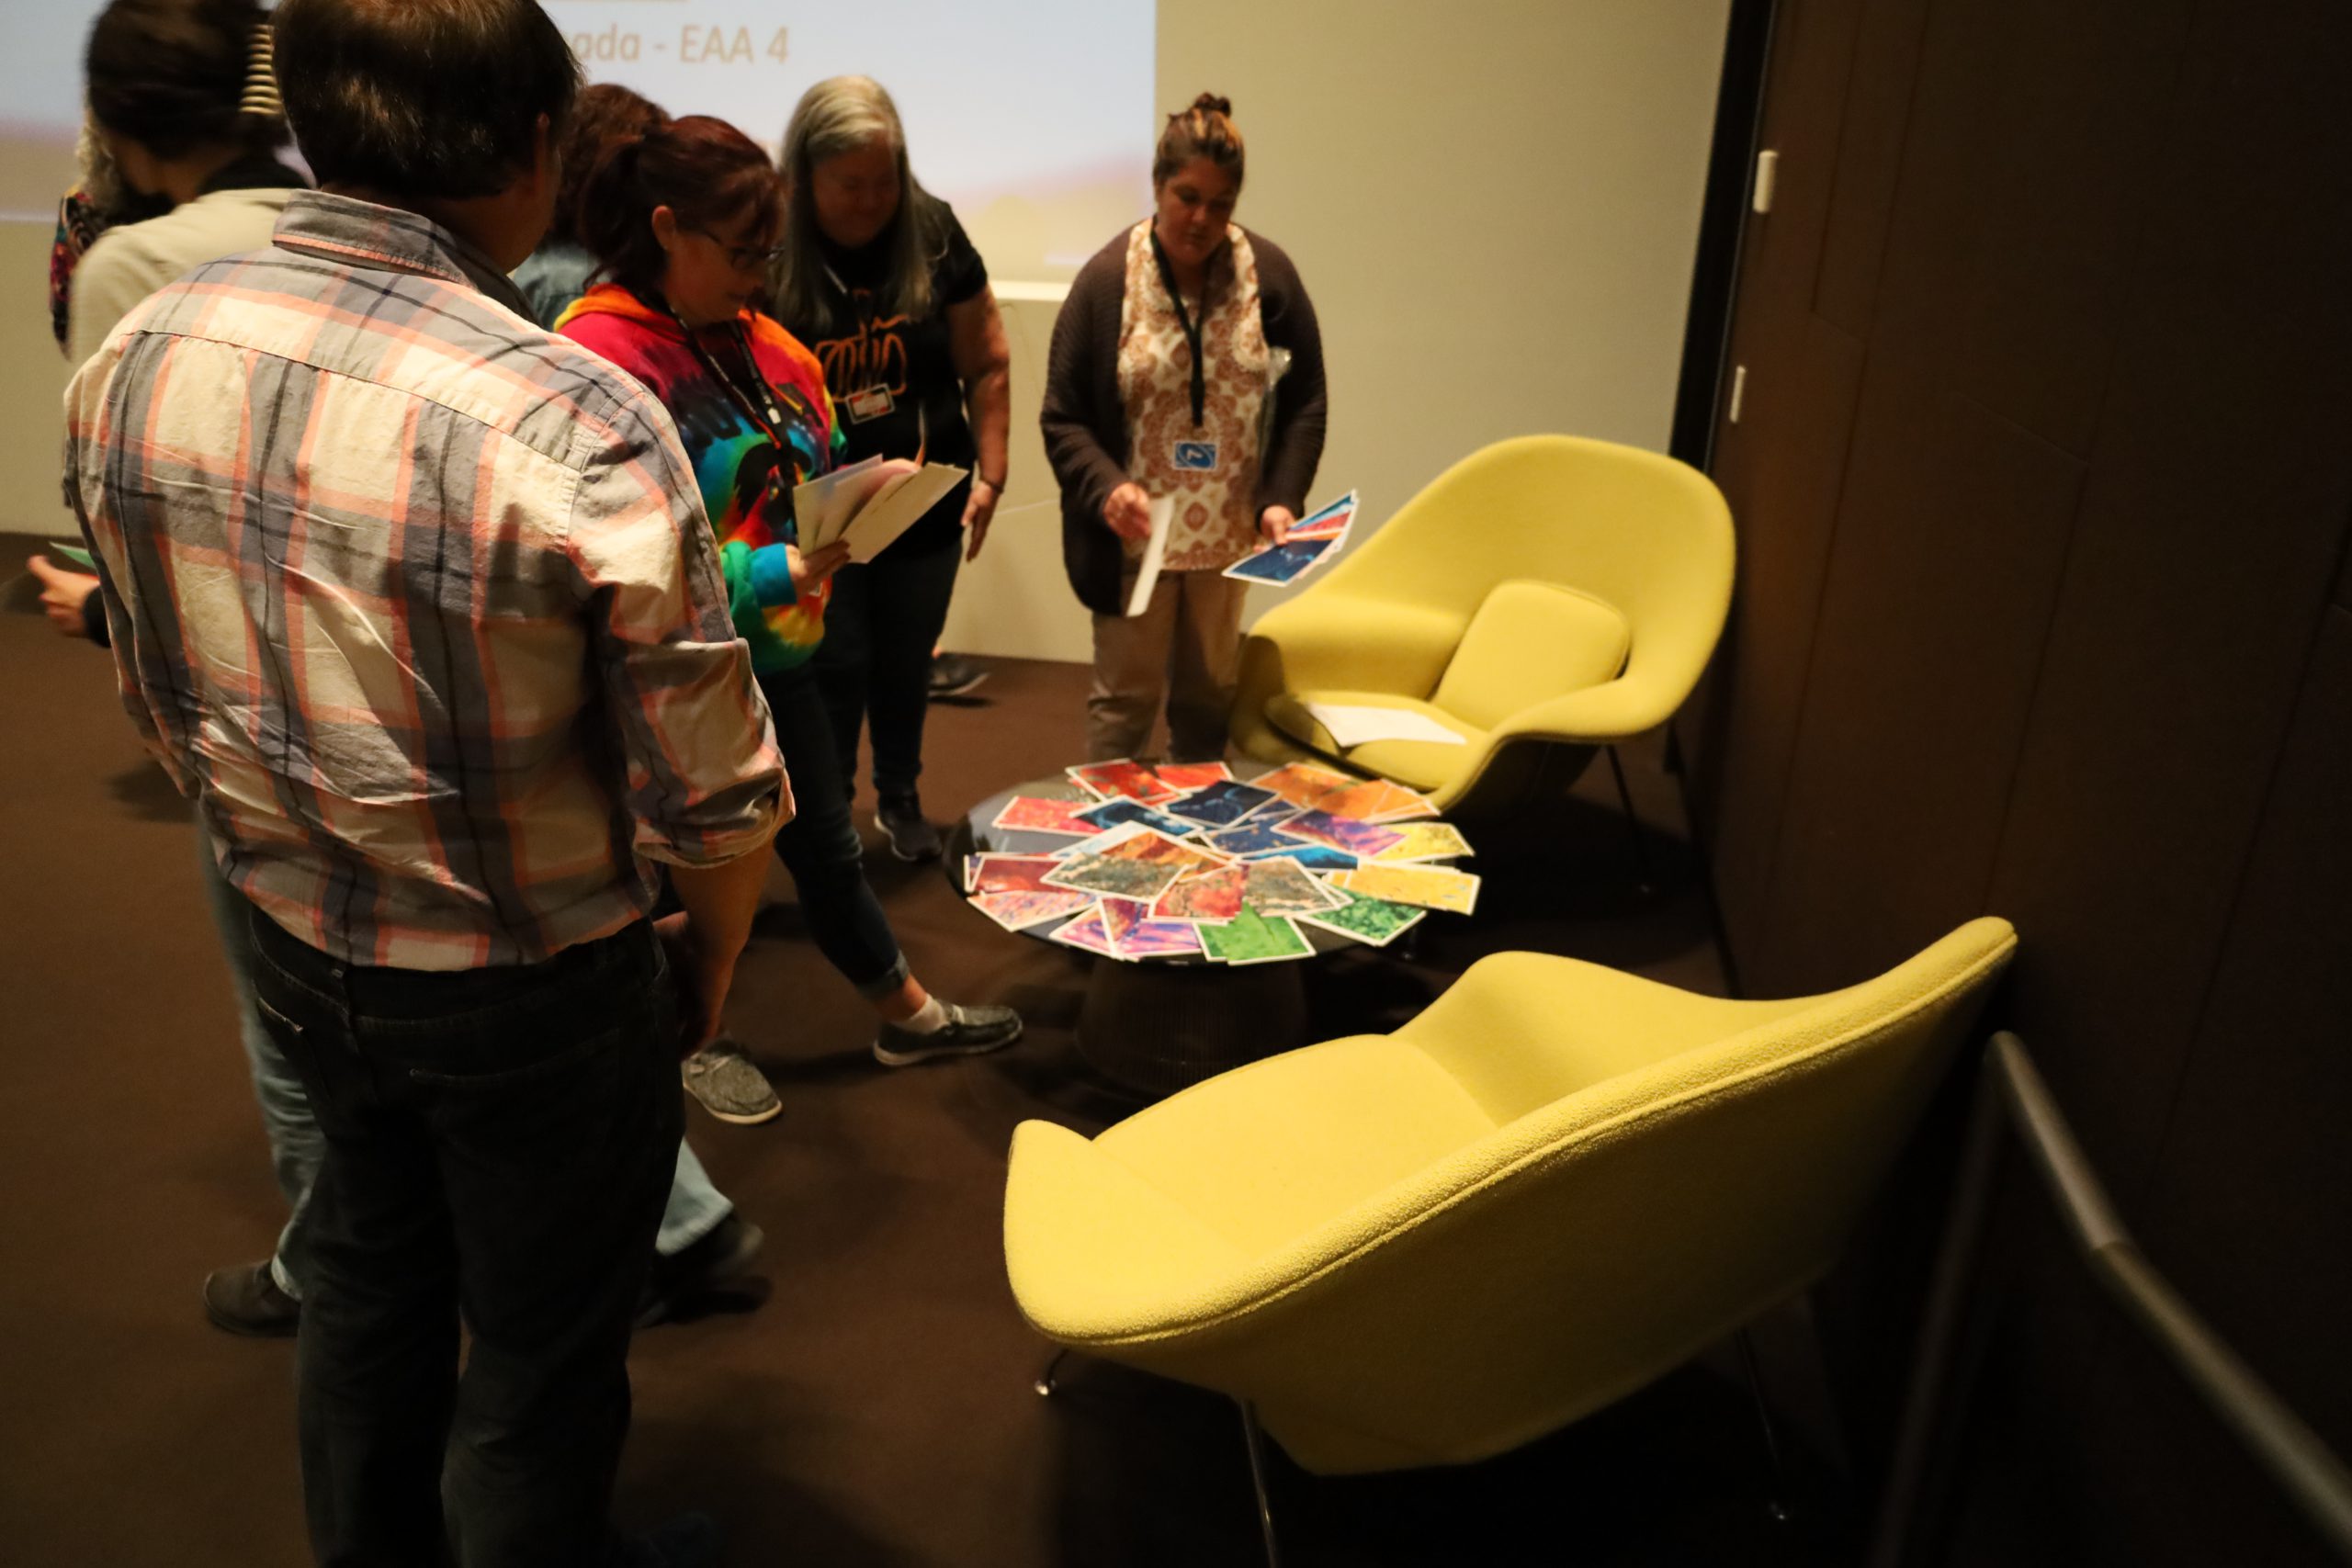
Teacher making a Landsat CollageTeachers making Landsat CollagesA finished Landsat CollageTeacher with finished Landsat CollageChoosing MaterialsParticipants with Landsat CollagesIowaView Staff Presentation