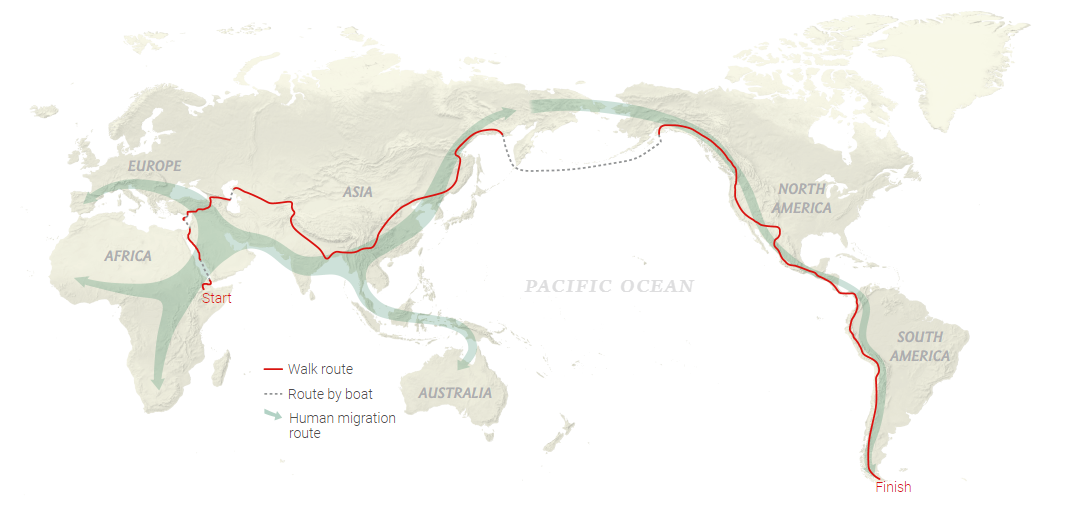
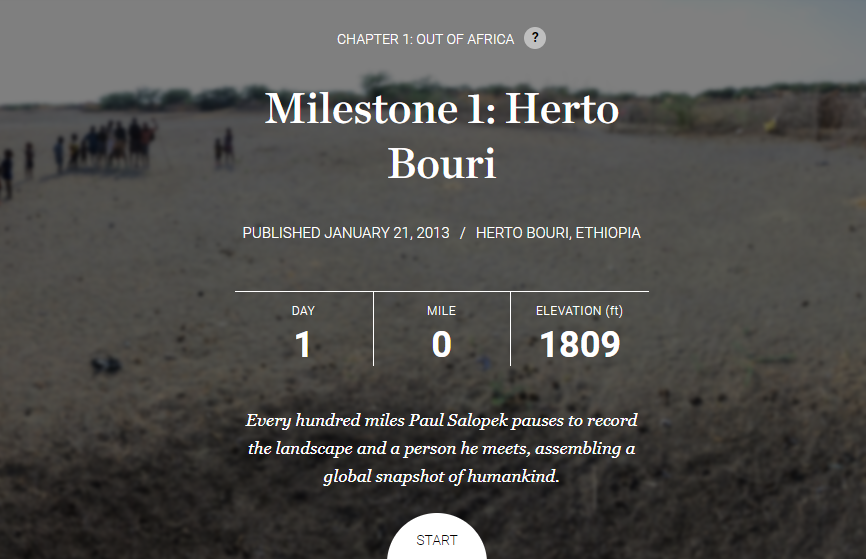
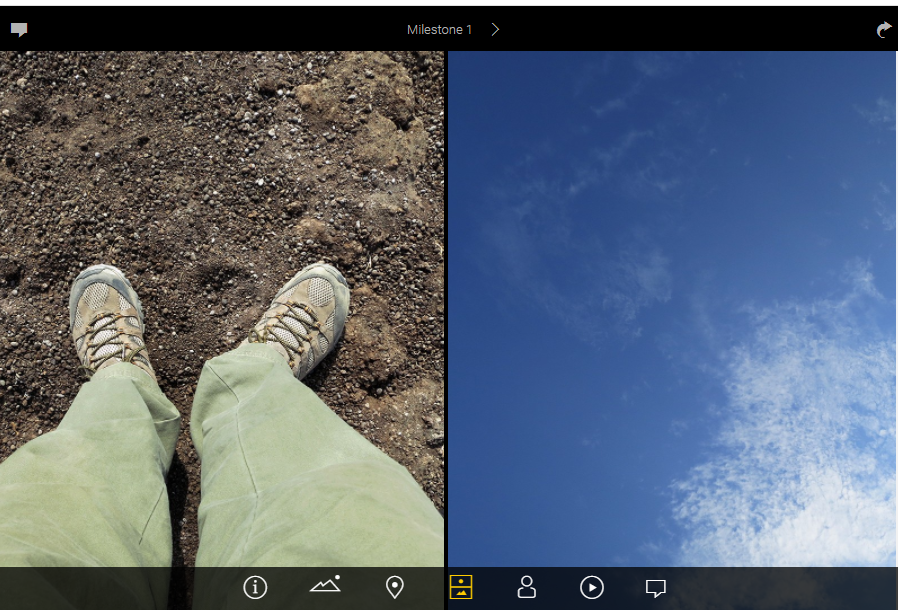
To kick off Geography Awareness week, explore the amazing journey of geographer, Paul Salopek’s 24,000 mile journey across the globe. During his 10-year journey he documented the places and people he encounter every 100 miles. At each of these milestones, he documents the date, location, elevation, shows a picture of his feet and the sky at that location, and interviews the first person he meets asking them 3 questions: who are you, where do you come from, and where are you going?
Postcards From Camp: Cities & Suburbs Are you exploring any cities this summer? Rain or shine, urban planners use Landsat to take stock of city growth and its environmental impact. The front of this postcard features a natural-color Landsat 8 image of Ocean Flower Island in Hainan, China acquired May 6, 2020.
Photo Credit: U.S. Air Force photo by Senior Airman Ian Dudley
Landsat 9 is scheduled to be launched on September 16, 2021. This will mark almost 50 years of earth observation by US satellites. In preparation for this historic launch, we will be sharing several interactive documents about the history of the Landsat mission as well as the information about the Landsat 9 mission.
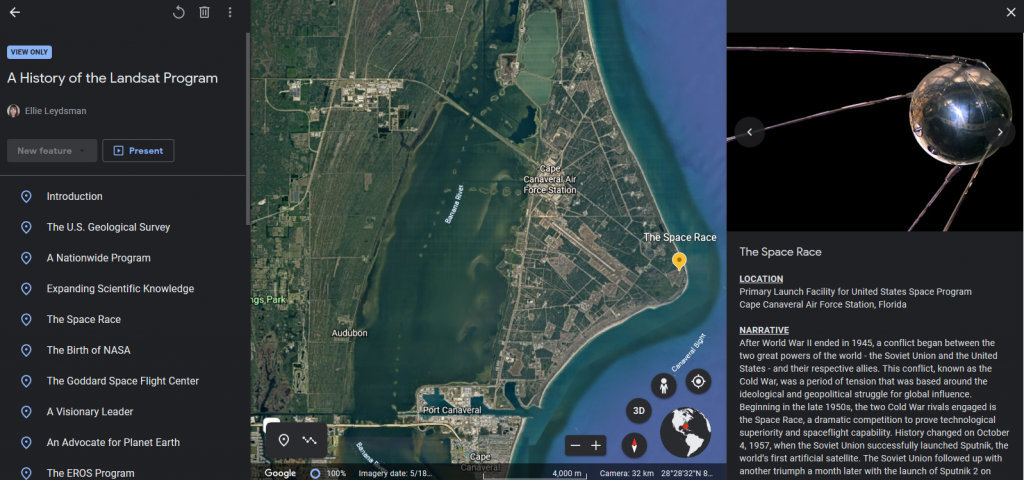
Today we would like to share with you, A History of the Landsat Program, developed by Ellie McGinty at UtahView. It’s an interactive Google Earth Tour, which documents major moments in earth observation history through a combination of maps, text, and curated images starting with the founding of the United States Geological Survey in 1879 through the birth of NASA in 1958 to the conception of Landsat in 1970 and all the way to the present day launching of Landsat 9.
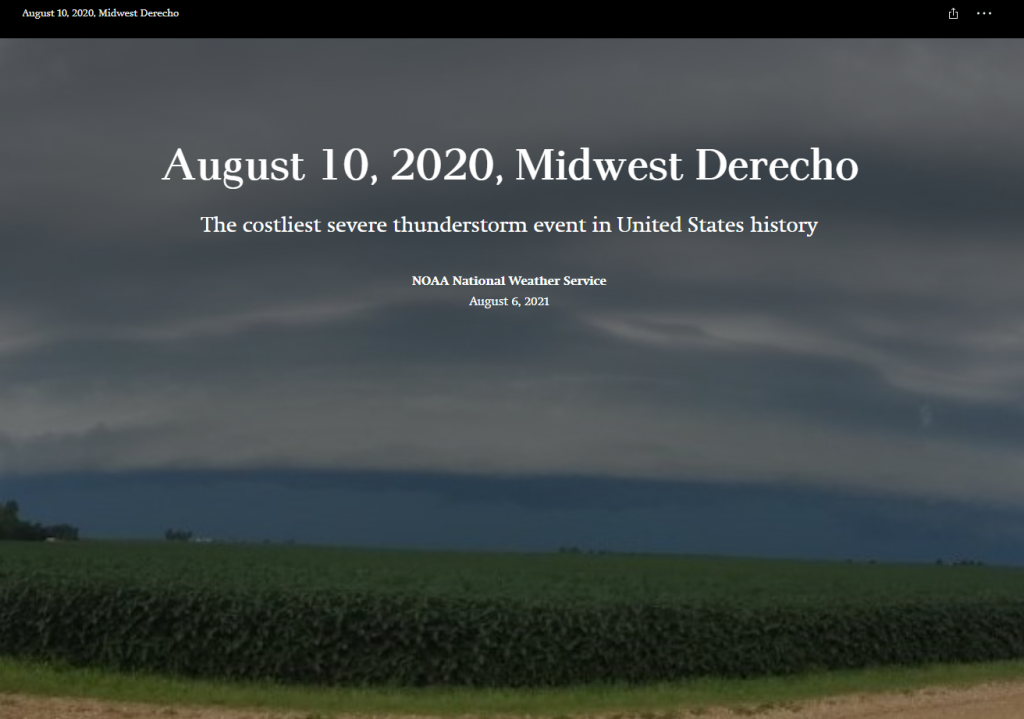
A year ago today a derecho, a series of thunderstorms with hurricane-like winds and heavy rains, struck Iowa with very little warning. The National Oceanic and Atmospheric Administration (NOAA) put together a multi-media story map to tell the tale of this eventful day. Hundreds of thousands of trees were lost or damaged. Homes and buildings were destroyed. Many people lost power for days or even weeks.
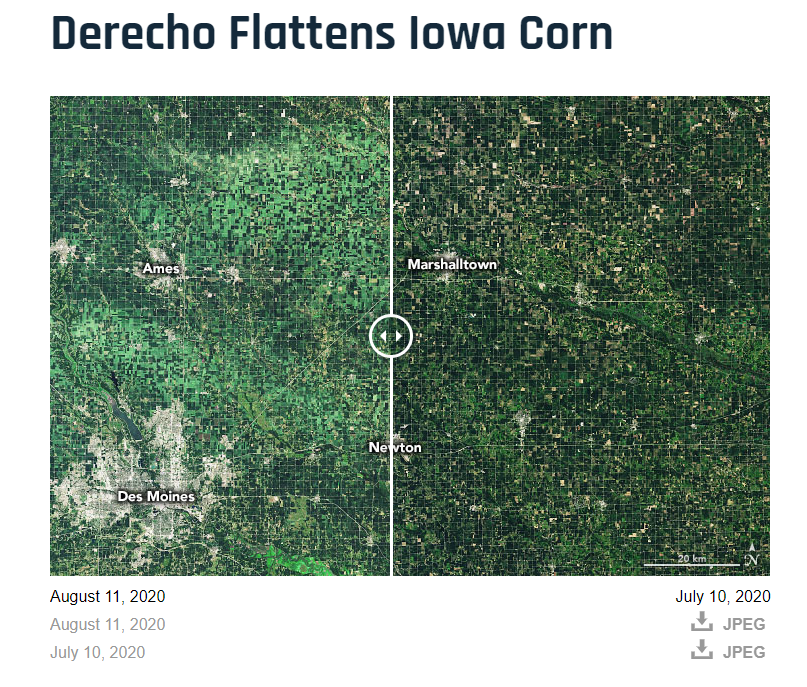
Have you visited the NASA’s Earth Observatory? It is a NASA website that helps make satellite imagery relevant to the general public and it is a great place to find images for presentations or use in the classroom. In August 2020, the Earth Observatory featured a comparison of satellite images from July 2020 and August 2020 to show the extent of the derecho damage on Iowa cropland.
IowaView staff have released the Cover Crop ID Toolbox and Handbook. This toolbox allows users to quickly identify possible cover crop fields using three Sentinel-2 images from the fall, early spring, and late spring downloaded from the Earth Explorer website based on field boundaries supplied by the user. On the project webpage you can download the toolbox which works with both ArcMap or ArcGIS Pro as well as the Cover Crop ID Toolbox Handbook that provides additional details about each step of the tool.
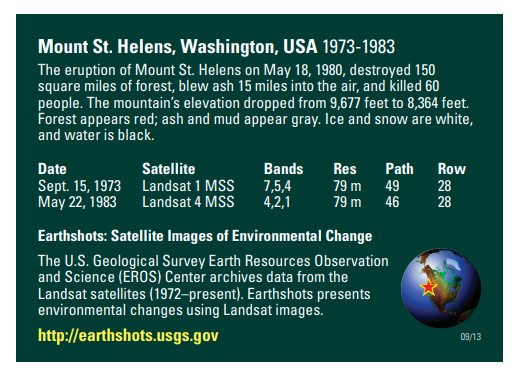
This week marks 40 years since the Mount St. Helens eruption. The image above is from the USGS Earthshots trading card series. The images are displayed in color infrared which is useful for showing living vegetation in red. The mountains surrounding Mount St. Helens are primarily forest. Notice the extreme change in the landscape from the 1973 image to the post eruption image in 1983. The damage was extensive and ash covered much of the surrounding forest land.
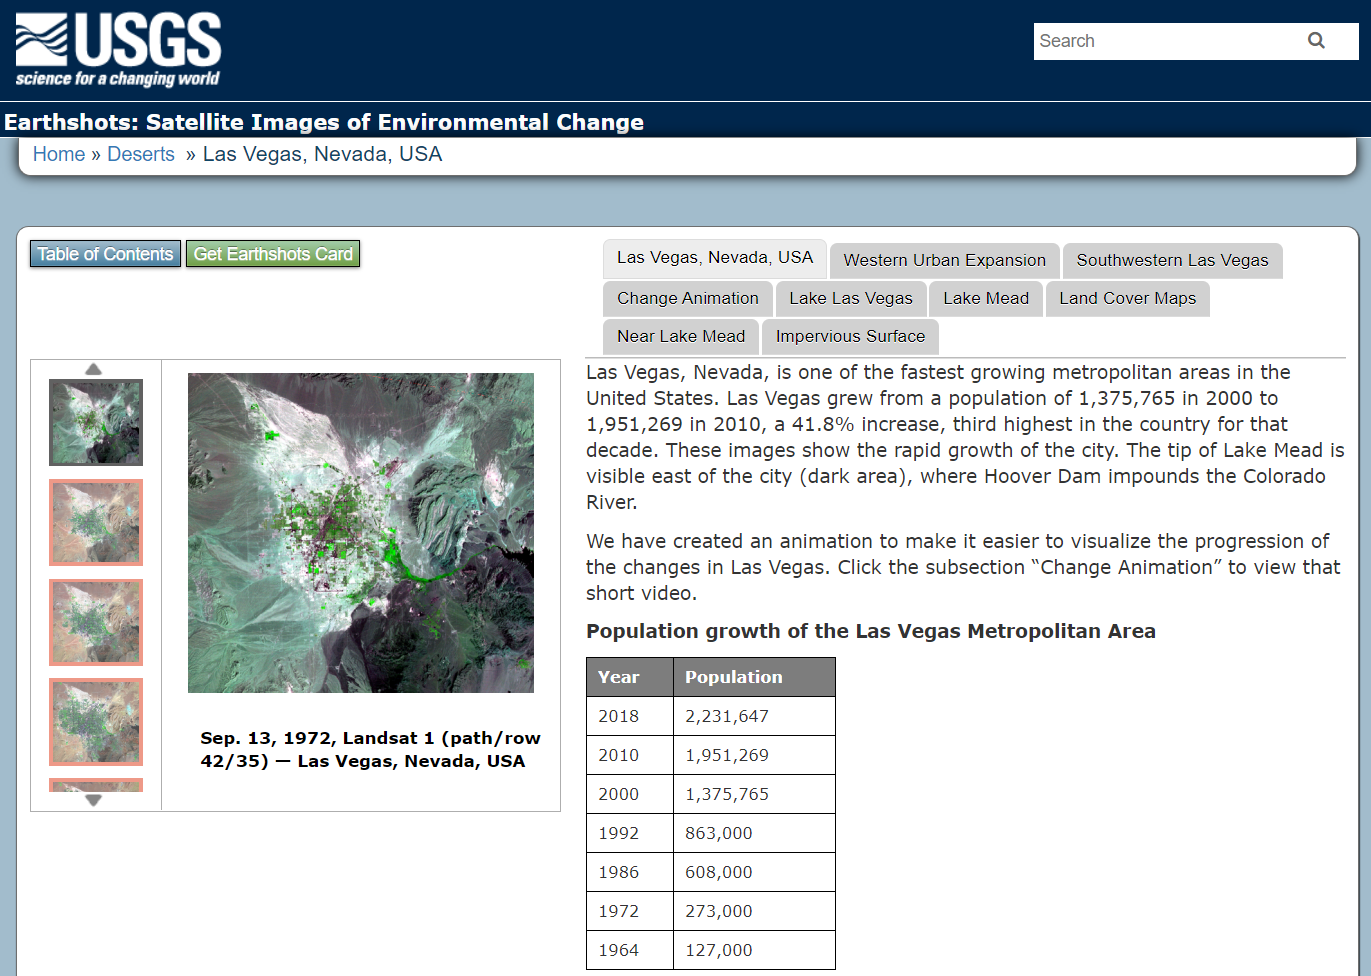
The USGS has produced an amazing collection of images (also available as trading cards!) that show Earth’s change over time. The Earthshot collection has a wide variety of examples of change over time including: – natural phenomena changes (glaciers, deserts,) – social change (city growth,) – human interaction with the natural world (mining, deforestation, agriculture,) – natural disasters (hurricanes, tornado damage, flooding.)
Below are two examples of the trading cards, Mount St. Helens pre/post volcanic explosion and Las Vegas, Nevada population growth over time.
The cards provide side by side comparison images and also context about the images on the opposite side including information about the date of the images, satellites, bands used to create the images and location data.
If you view a location on through the browser you will get about 5 images you can review as well as context about the images.
A couple weeks ago Bloomberg News posted an interesting article (click here to read the article) showing how the stay at home orders are effecting areas around the world using high resolution satellite imagery. Below is an example showing Venice, Italy on October 20, 2019 compared to March 18, 2020 after the residents were asked to stay at home. It is interesting to compare the water clarity and traffic.
Venice, Italy: Notice the change in water traffic and water clarity after the Italy began ordering residents to stay at home. Source: Bloomberg.com
The article highlights numerous sites around the globe including: Wuhan, China (before shutdown / after shutdown); Mecca in Saudia Arabia; Venice, Italy; Epcot Center in Florida, USA; Tianjin, China; and Miami Beach, Florida, USA.
As you look out your window you may be noticing that grass is beginning to green up, the lilac bushes are growing new leaves, and a robin is gathering material for a nest. These observations are scientifically termed phenology– the study of cyclic and seasonal natural phenomena relating to climate, plant, and animal life.
As spring begins with many of us social distancing it is a good time to turn our attention towards nature and consider joining the National Phenology Network USA’s Nature’s Notebook program. Nature’s Notebook is a group of volunteer observers (students and citizen scientists) from around the USA who pick an observation site and commit to regularly recording data about it throughout a season. This data can then be used by scientists around the world to better understand changes in climate and plant/animal life around the country.
The Nature’s Notebook website has many useful resources for establishing your observation site as well as ideas for which species to observe. The website also has activities and lesson planning ideas for children and young people. Participating in Nature’s Notebook might be a good adventure during the weeks that school is closed and the days are getting nicer.


