Annually, the United Nations celebrates March 22nd as World Water Day. World Water Day celebrates water and raises awareness of the 2.2 billion people living without access to safe water. The day is about taking action to tackle the global water crisis, and remembering what a vital role water plays for all of humanity. This year, the theme of World Water Day is “SAVE OUR GLACIERS,” with a focus on glacier preservation. Therefore, no matter where we live, glaciers are critical to our water future.
“I don’t live near a glacier. Why should I care about glaciers?”
Glacier Facts: 70% of the Earth’s fresh water exists as snow or ice. Around 10% of the Earth’s land area is covered by glaciers or ice sheets.
Glaciers are part of the “cryosphere” which impacts every living being on the planet. The word “cryosphere” originates from the Greek word ‘kryos’ for frost or ice cold. The cryosphere extends across the globe and can appear seasonally (like snow in Iowa) or be permanently present in most parts of the world. The snow, glacier, permafrost, and frozen ground are significant storage and sources of freshwater, sustaining ecosystems and supporting livelihoods in and far beyond the regions where these are located. While you watch the video below you will learn about the cryosphere and how it’s changing.
Undeniably, all living beings depend directly or indirectly on the cryosphere. For example, as all major rivers originate from mountains, the mountain cryosphere plays an important role in providing and regulating freshwater resources for around half of the world’s population. Furthermore, alterations and loss of critical snow and ice are increasing the risk of other hazards.
The state of cryosphere is also a useful indicator for climate variability and change. Therefore, improved monitoring is critical to understand Earth’s weather, climate, and water cycles. The cryosphere, its changes, and its impacts have received increased attention in recent years, creating a demand for authoritative information on the state of the world’s snow and ice resources.
As shown above in the video, glaciers are extremely important to help regulate the earth’s temperature. Glaciers, snow, and ice reflect much of the sun’s radiation into space (keeping those areas cooler), unlike the bare ground or open ocean water, which absorb the radiation (making them warmer). Glaciers also store freshwater and are an essential part of the water cycle.
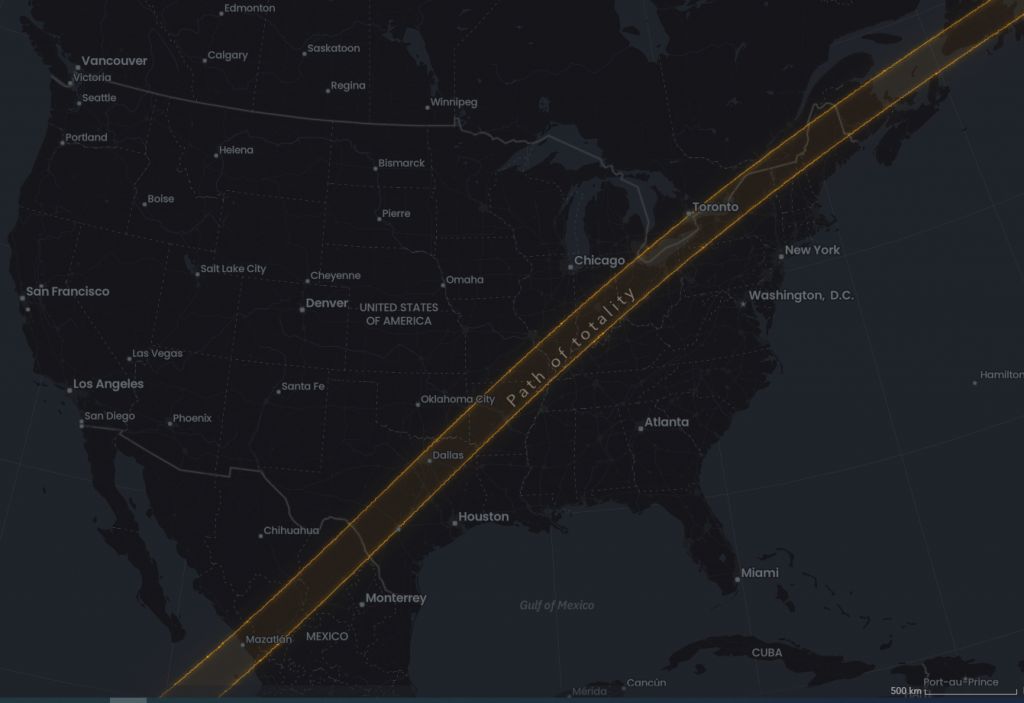
As this year comes to a close, many people take time off for rest and celebration. Here are a few fun maps and StoryMaps that have some holiday themes or can help you plan for adventures in 2025.
Are you ready to plan your big vacation for 2025? The Esri Team has made a fun and interactive guide to help generate some vacation ideas with the Vacation Locations StoryMap.
Enjoy these Mappy holidays, cheers, and have a happy, mappy New Year!
Winner of the Map Category – Mapping My Biking Journey with Distance of Distinct Traveled Paths Created by Atlas Chenxiao Guo from University of Wisconsin-Madison Map Description: This map shows all my biking tracks, including the majority in the US and few Chinese cities. All the circled track maps have the same scale. Each path is counted only once in the distance calculation. For more information Click Here!
Mapping My Biking Journey with Distance of Distinct Traveled Paths Software/Materials Used: ArcGIS Pro; Adobe Illustrator
Winner of the StoryMap Category – Iowa Freedom Rock Tour Created by Trenton Major, College of Agriculture and Life Sciences – Iowa State University StoryMap Description: This Story Map displays the locations of Iowa’s Freedom Rocks and scenic routes. It is designed to help users navigate the Freedom Rock Tour within the state of Iowa.
Iowa Freedom Rock Tour Software/Materials Used:ArcGIS Online, ArcGIS StoryMaps
Thank you again to everyone who participated in this year’s competition!
The ISU GIS Facility will be hosting the 3rd annual geospatial summer workshop for K-12 teachers and pre-service teachers in Ames, Iowa on July 17 – 18, 2024. This workshop will show many geospatial tools and applications from the Esri ecosystem as well as Google Earth, OpenStreetMap, AmericaView, and others. Teachers will get to see a variety of map tools and exercises that they can bring into current lessons. We will explore resources available at local, state, and national levels. Each participant will make a StoryMap to use in their classroom. Teachers can sign up for graduate or continuing education credit. Please email Amy Logan with any questions.
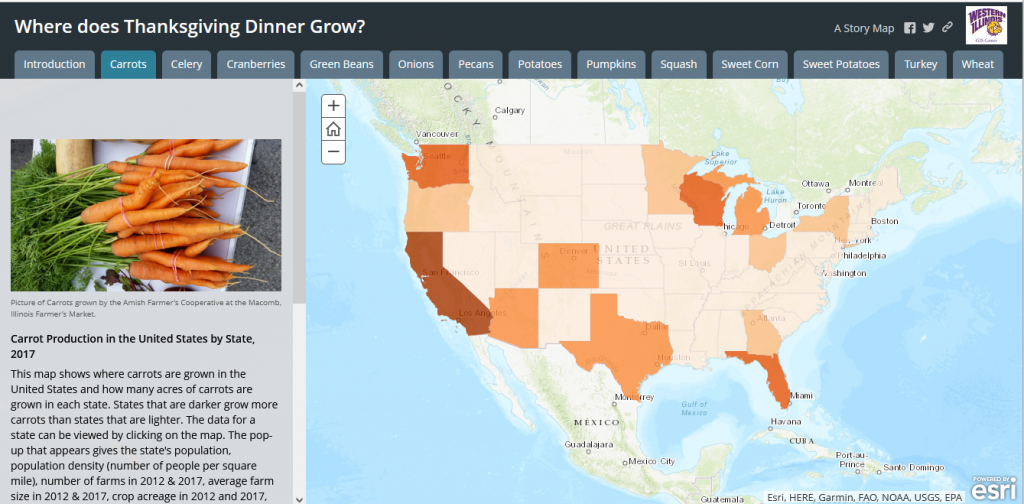
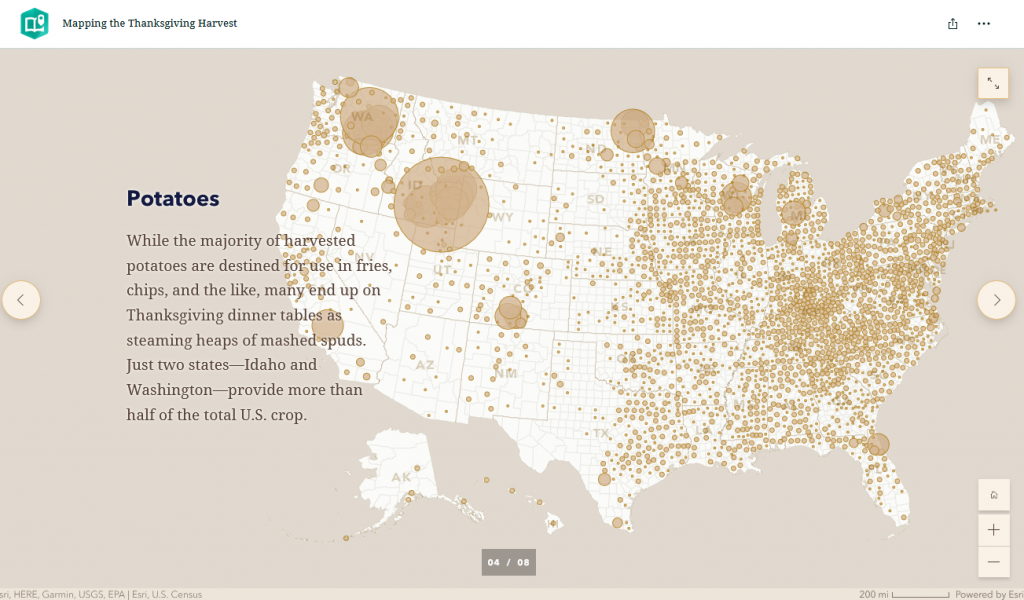
This week as you gather with family and friends for a nice holiday meal take a minute to think the people who grew or produced your food and about all the places different staples come from. Below are two maps, “Where does Thanksgiving Dinner Grow?” created by Linda Zellmer and “Mapping the Thanksgiving Harvest” by David Asbury. Click on the map images below to explore the maps.
Linda Zellmer, a Government Information & Data Services Librarian at Western Illinois University has a series of maps showing the states with the high production of Thanksgiving staples using 2017 data. Linda created maps for the staples data over the course of a 20 year period (1997-2017). For her GIS data, maps, and a Thanksgiving meal poster visit: http://faculty.wiu.edu/LR-Zellmer/thanksgiving.html
David Asbury, a member of the Esri StoryMaps Team, created this map series which shows production of staples at the county level using 2012 USDA Census of Agriculture data.
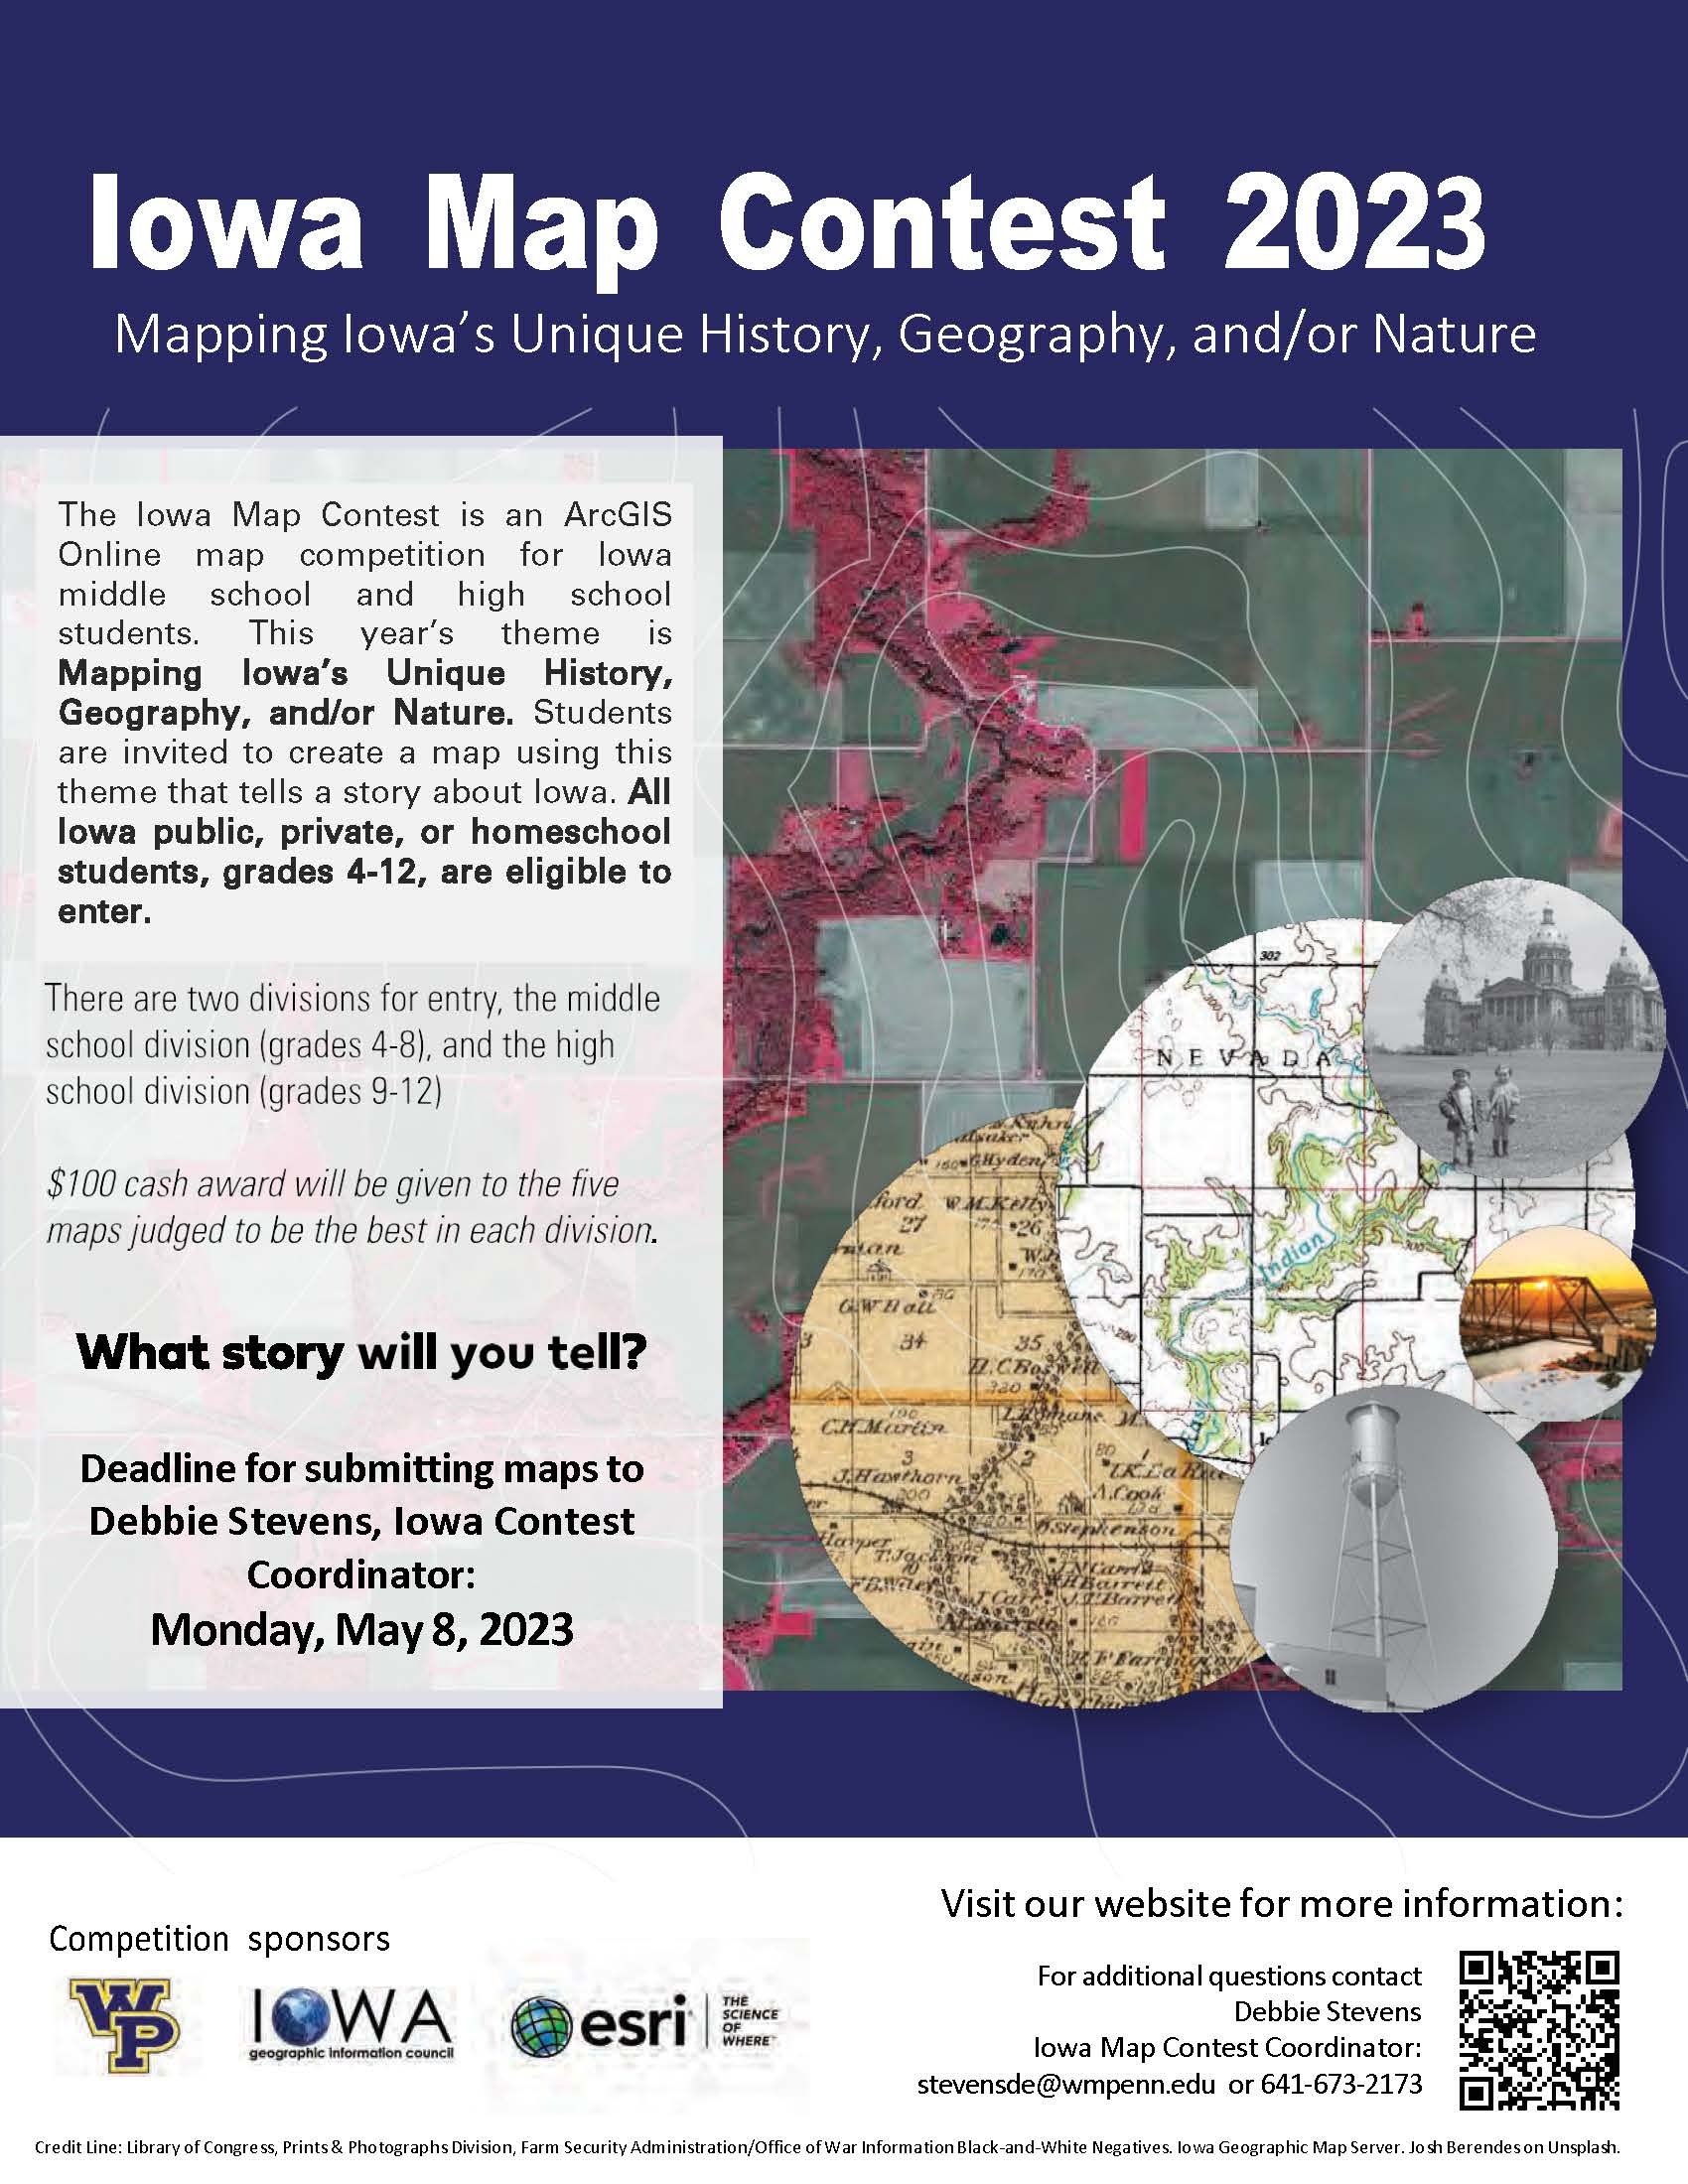
Here’s a great opportunity for Iowa students in grades 4-12. The Iowa Map Contest is an ArcGIS Online Story Map competition for students to tell Iowa stories. Each school can submit up to five entries. Entries are due Monday, May 8, 2023. For more information about the Iowa Map Contest, visit the contest website: https://sites.google.com/site/iowamapcontest/.
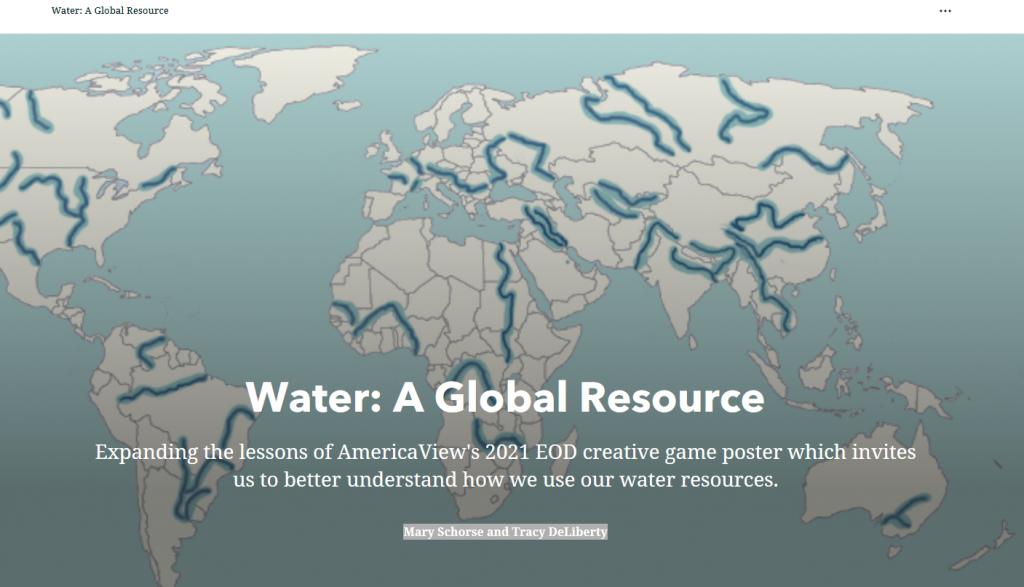
A StoryMap developed by Mary Schorse and Tracy DeLiberty (DelawareView)
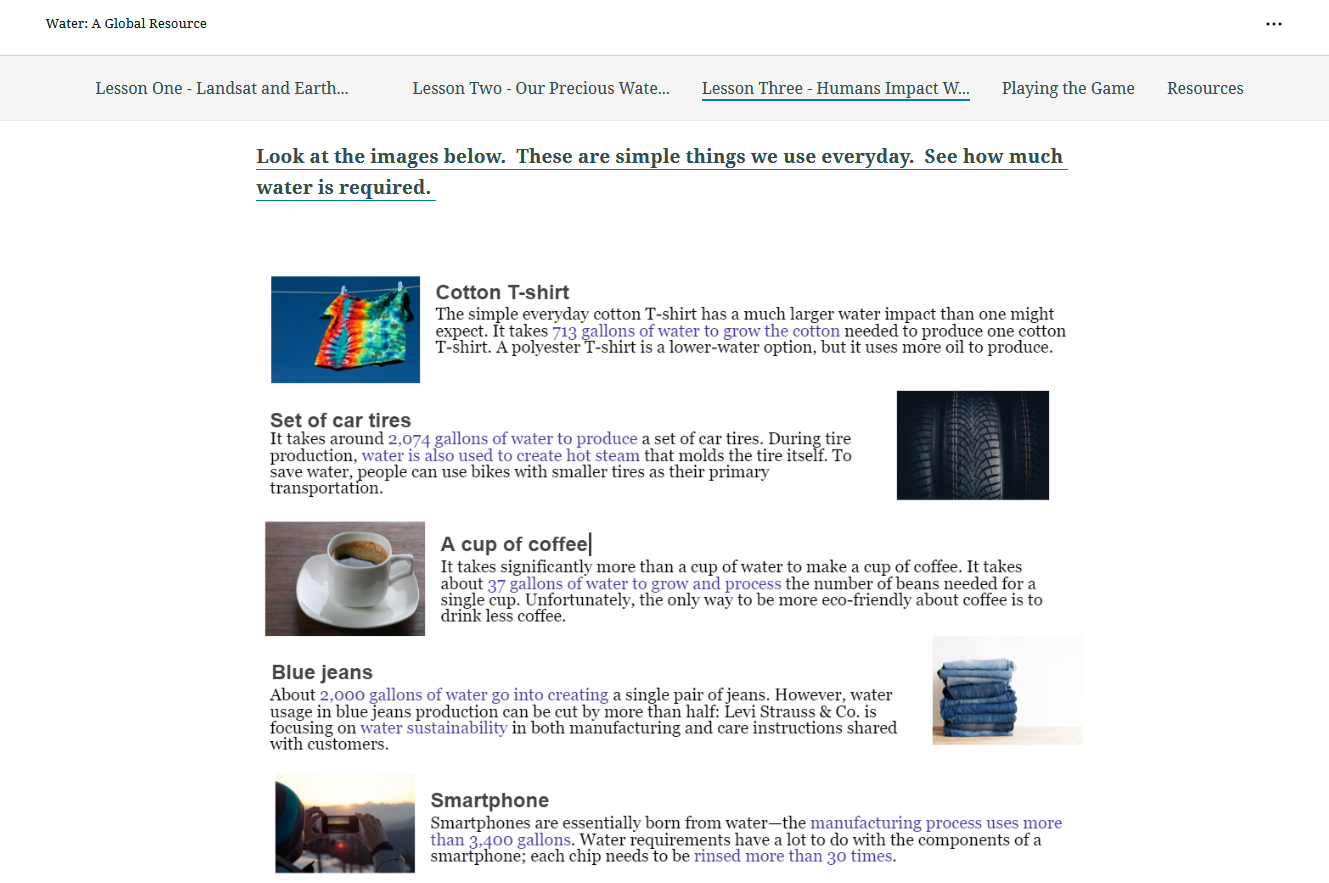
Have you ever thought about how much water it takes to make a pair of jeans? To produce a pound of corn? Or to make a car? What if you had a limited amount of water and had to decide how to “spend” your precious resource? Water: A Global Resource is an ArcGIS StoryMap, developed by Mary Schorse and Tracy DeLiberty (DelawareView), is designed to give you background on what we mean by ‘water resources.’ The lessons are also designed to stimulate your thinking about how we use, protect and monitor this precious, limited natural resource.
Screen shot from the Water: A Global Resource StoryMap
February was Black History Month and March is Iowa History Month (as well as Women’s History Month).
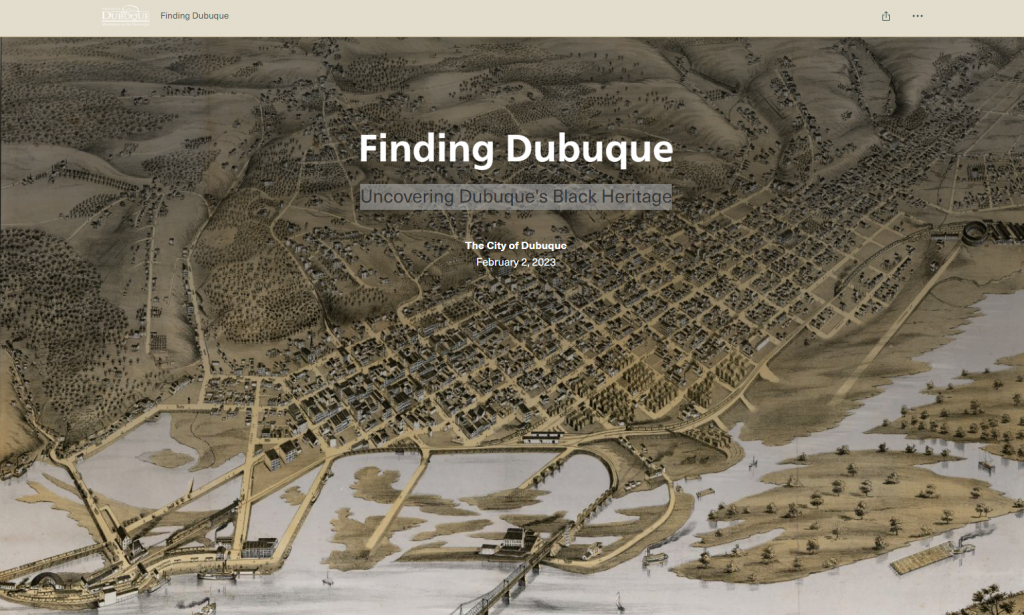
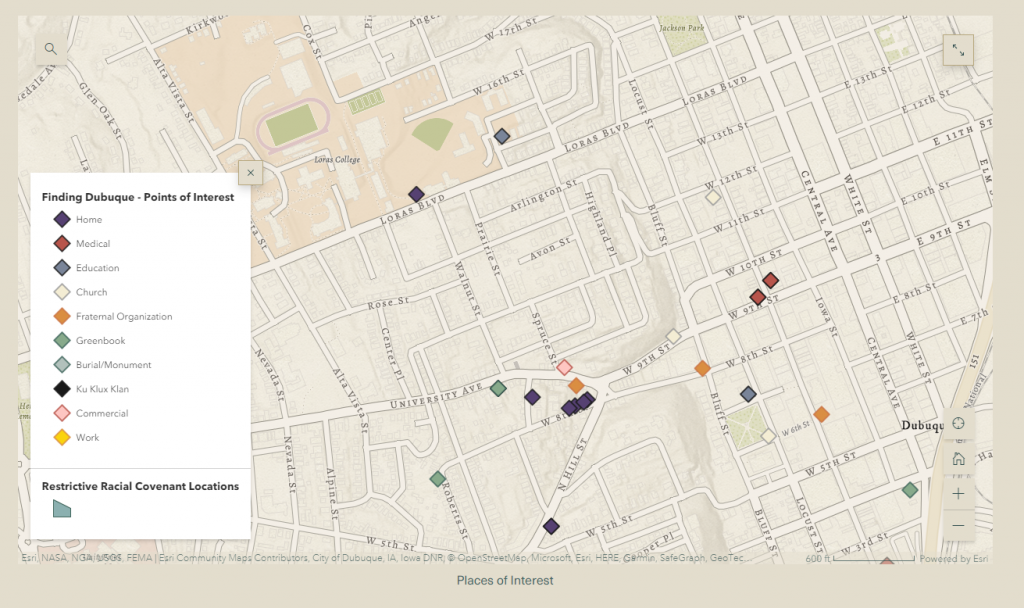
Points of Interest – Finding Dubuque ArcGIS Story Map
Image from Story Map
We are highlighting a map that celebrates Black Iowans in Dubuque, Iowa. Last fall, the City of Dubuque produced an ArcGIS Story Map called Finding Dubuque: Uncovering Dubuque’s Black Heritage. This Story Map shares stories of some of Dubuque’s early black residents and their contributions to the community as well as those of today. The Story Map also includes challenging parts of Dubuque’s past including redlining of insurance maps, real estate covenants restricting the tenure of black residents to certain land parcels and stories of the Ku Klux Klan in Dubuque.
Take time to learn more about the history of Black Iowans in Dubuque.