Exploring the Landscape of K12 GIS Education in Iowa Story Map – Part 1: Spring 2021
This is a story map sharing the results of IowaView’s Spring 2021 survey of Iowa public school superintendents and K-12 teachers to understand how GIS and remote sensing were currently being used in K-12 school districts and classrooms in Iowa. The surveys also provided starting point for outreach and a way to assess if there is a need to improve access to available resources such as Esri’s free educational licensing and educational materials as a way to build a foundation of GIS education throughout the state.
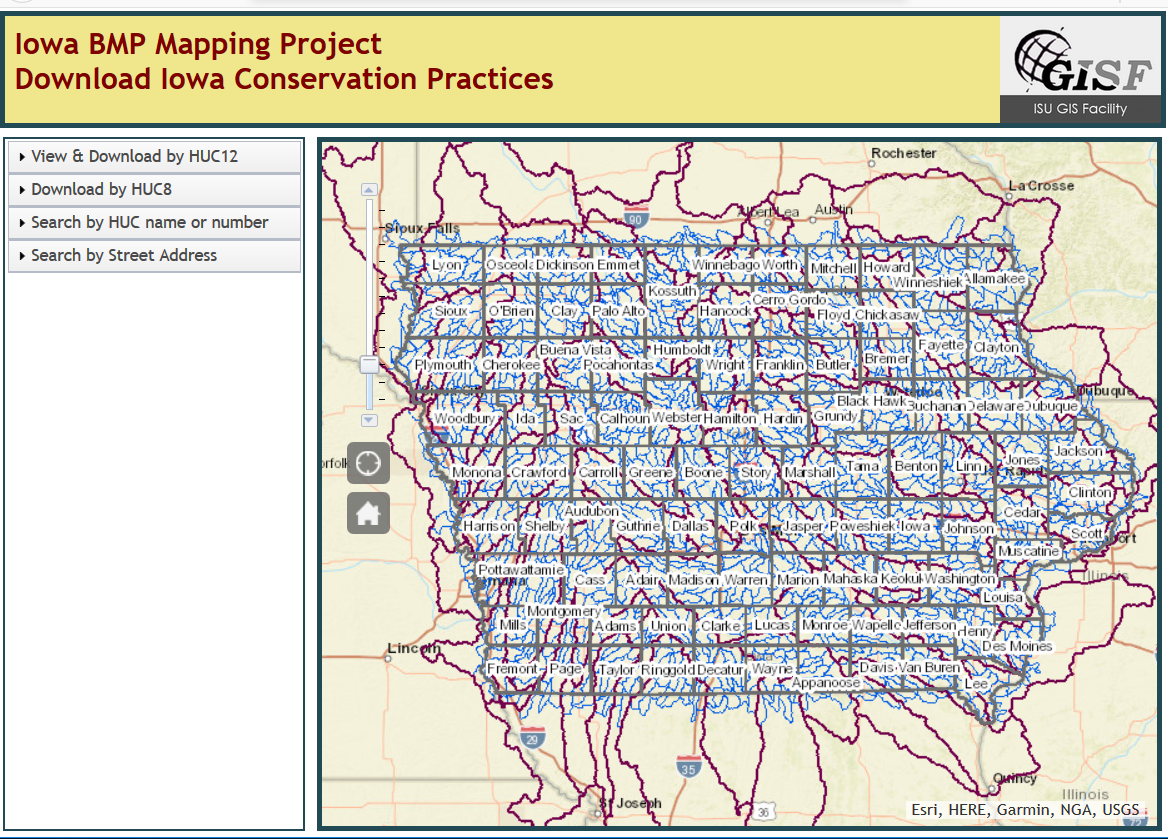
Iowa BMP (Best Management Practices) Mapping Project Handbook and Tutorials
Check out the online tool: https://benson.gis.iastate.edu/ISU/BMP/BMP.html

Iowa BMP (Best Management Practices) Mapping Project Handbook – This document provides an overview of the Iowa BMP project and three associated projects. It provides background on the project, information about the data structure and necessary input data, descriptions and images of the conservation practices, management considerations, and additional documents needed for project tracking. Here is a zip with the accessory files
Tutorial 1- Digitizing Conservation Practices Tutorial zip – Tutorial 1 is a basic guide for creating the six conservation practices in the baseline conservation inventory data set and associated files. This zip includes a pdf of the tutorial, an mxd, a file geodatabase containing the necessary data and a solutions folder with the completed file geodatabase.
Tutorial 2 – Historical Occurrence Evaluation Tutorial zip – Tutorial 2 provides instructions on how to perform historical evaluations as well as updates using the baseline conservation inventory dataset. This zip includes a pdf of the tutorial, an mxd, a file geodatabase containing the necessary data and a solutions folder with the completed file geodatabase.
Tutorial 3 – Identifying and Mapping Tile Drainage Tutorial.pdf – Tutorial 3 explains the methods used to identify and map tile drainage using high resolution imagery. Accessory files in a zip, include a pdf of the tutorial, an mxd, a file geodatabase containing the necessary data, a tile mapping reference folder (containing an additional file geodatabase, DEMs (digital elevation models), shapefile, and tif) and a solutions folder with the completed file geodatabase and mxd.
Earth As Art Educational Materials – developed as part of the IowaView Spring 2017 Earth as Art exhibit
Educational Posters
More that Just a Pretty Picture: How Landsat images are made – this educational poster briefly explains how we see light. Our eyes can only detect a small section of the light energy (electromagnetic spectrum) that is around us – .45-.67 nanometers. The Landsat satellite can collect a much broader range of energy .43-2.29 nanometers. The satellite collects all this information at one time but in different layers called bands. There are at least 7 spectral bands that are collected. We can only visualize combinations of three of them at a time. The images in the gallery are various combinations of mixed light energies.
Image Locations – this educational poster shows where the images are located across the globe.
Exhibit Connection Guides
Color Wheel Madness – this exhibit connection guide explains the basics of how we see color and provides instructions to create a color wheel.
Building a Simplified Landsat 8 Satellite Model – this exhibit connection guide give a brief explanation of the Landsat mission and some of its uses as well as instructions and printouts for a simplified Landsat 8 satellite. Note: Only one solar panel is needed per model. We have removed some sensor parts for ease of building at the exhibit, for a complete, satellite design see: https://landsat.gsfc.nasa.gov/spacecraft/
Earth as Art Scavenger Hunt – Find them all!