
Newly Released!
VirginiaView is excited to announce the release of Working wih Lidar Using ArcGIS Pro. It is available for free via Kindle unlimited or in paperback on Amazon for $60.
VirginiaView is excited to announce the release of Working wih Lidar Using ArcGIS Pro. It is available for free via Kindle unlimited or in paperback on Amazon for $60.
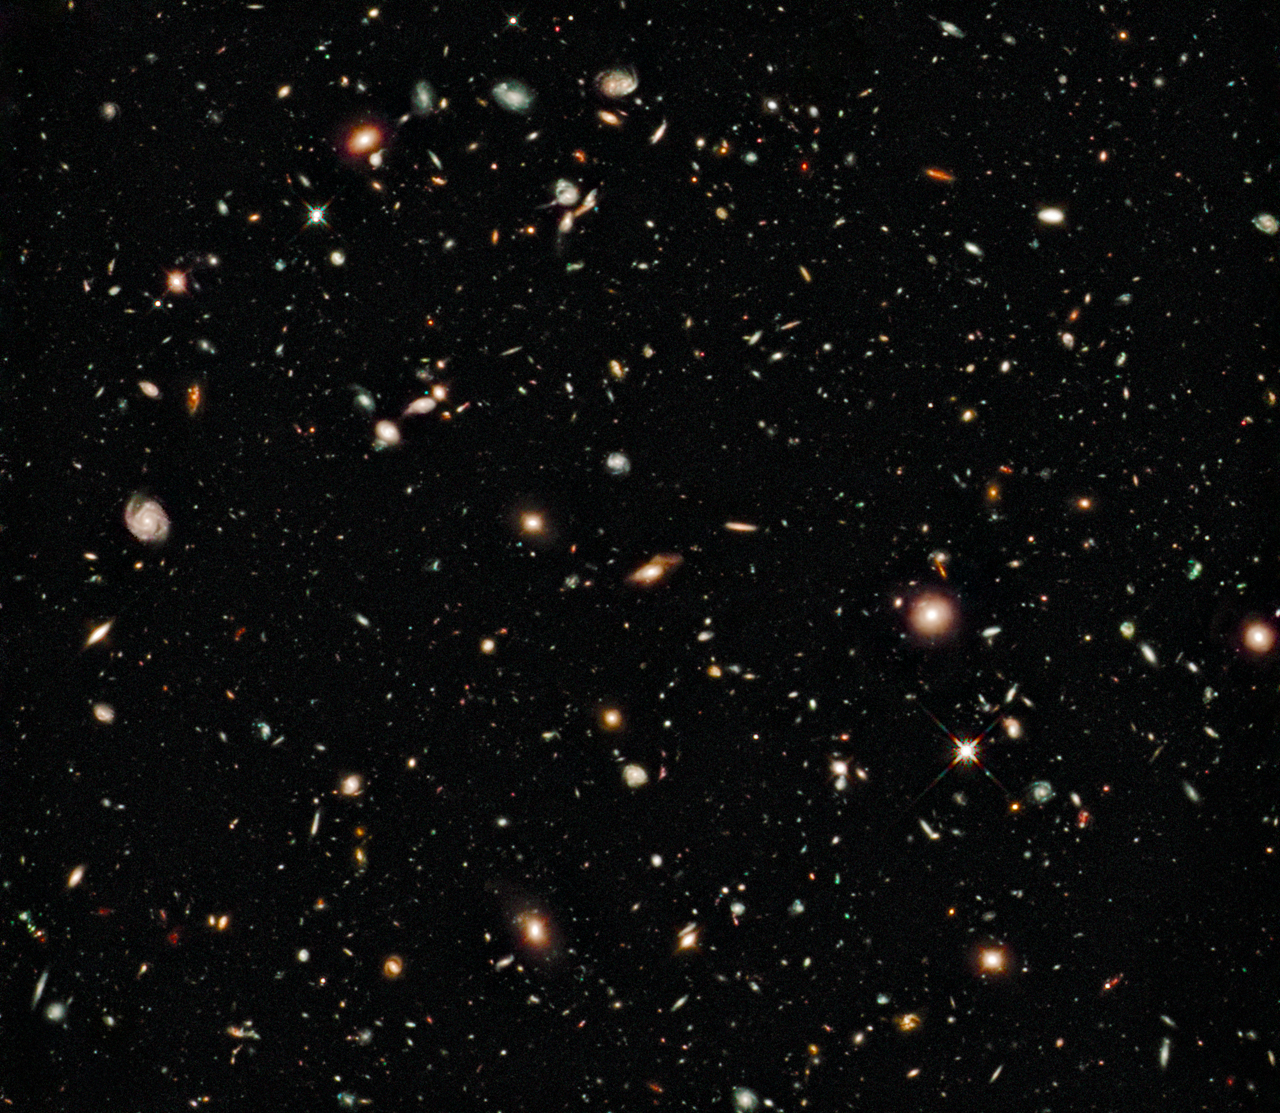
Today we celebrate 30 years since the Hubble Space Telescope began it’s orbit above Earth. In these thirty years, NASA has been able to discover and photograph so many new areas of our universe.
The Hubble Space Telescope was the first major optical telescope to be placed in space. This placement in space allows the telescope to get beyond the distortion of our atmosphere with it clouds and light pollution to make unobstructed observation of the universe. The Hubble telescope has allowed scientists to view the planets of our solar system as well as other galaxies.
Resources:
NASA Hubble Space Telescope: https://www.nasa.gov/mission_pages/hubble/main/index.html
Hubble’s 30th Anniversary: https://www.nasa.gov/content/hubbles-30th-anniversary
Hubblesite Resource for Learning: https://hubblesite.org/resource-gallery/learning-resources

This Wednesday (April 22, 2020) will mark the 50th anniversary of Earth Day. While many of the large scale celebrations will have to be postponed; here are some ideas for ways to celebrate in your home or neighborhood.
#EarthDayAtHome with NASA – this website has a great collection of activities to explore our world. Here are a few that you might want check out: Terrestrial Tournament (vote for your favorite Earth images), Hit the Bricks (instructions for creating LEGO models Model 1 and Model 2), NEMO-NET (mapping coral reefs), download the ebook “Earth at Night” to view amazing images of our planet at night.
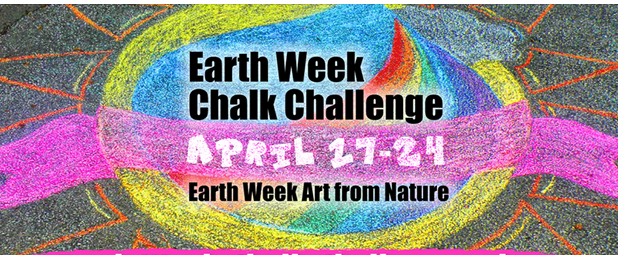
Water Rocks!, an Iowa based water education campaign, has two exciting Earth Week art contests.
1) Create a sidewalk chalk masterpiece showing your love for natural resources or ways to help protect planet Earth.
2) Gather interesting objects you find outside to create art from nature!
Check out the Water Rocks website for full details: https://www.waterrocks.org/.
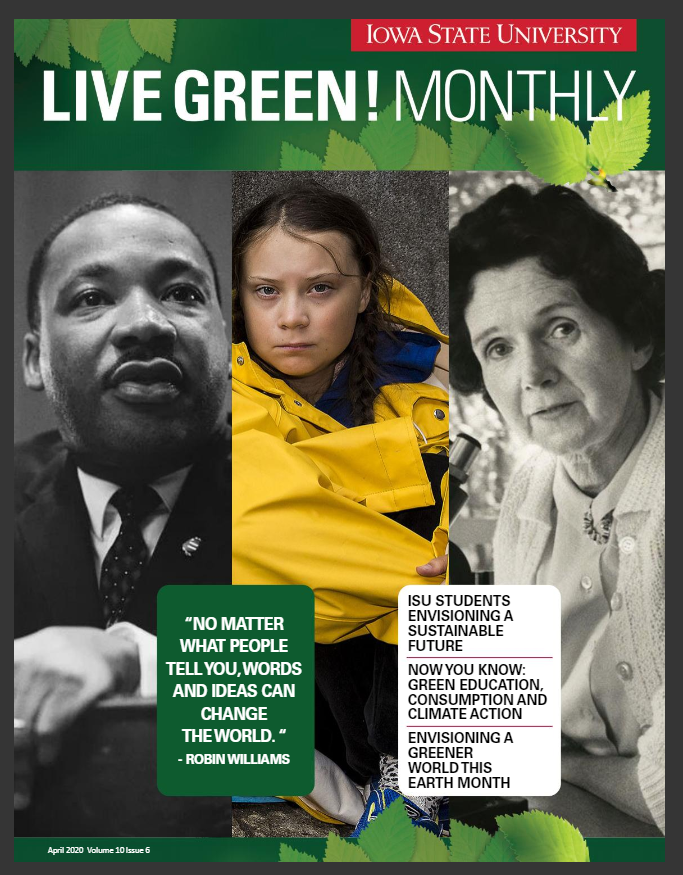
ISU’s Live Green Monthly Newsletter is also another resource to find ideas for celebrating Earth Day. It is filled with practical tips for living more sustainably, fun DYI Green activities, opportunities for living green as well as other interesting articles.
Have a happy Earth Day!
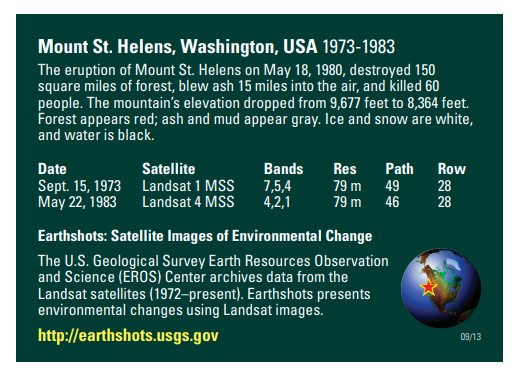
The USGS has produced an amazing collection of images (also available as trading cards!) that show Earth’s change over time. The Earthshot collection has a wide variety of examples of change over time including:
– natural phenomena changes (glaciers, deserts,)
– social change (city growth,)
– human interaction with the natural world (mining, deforestation, agriculture,)
– natural disasters (hurricanes, tornado damage, flooding.)
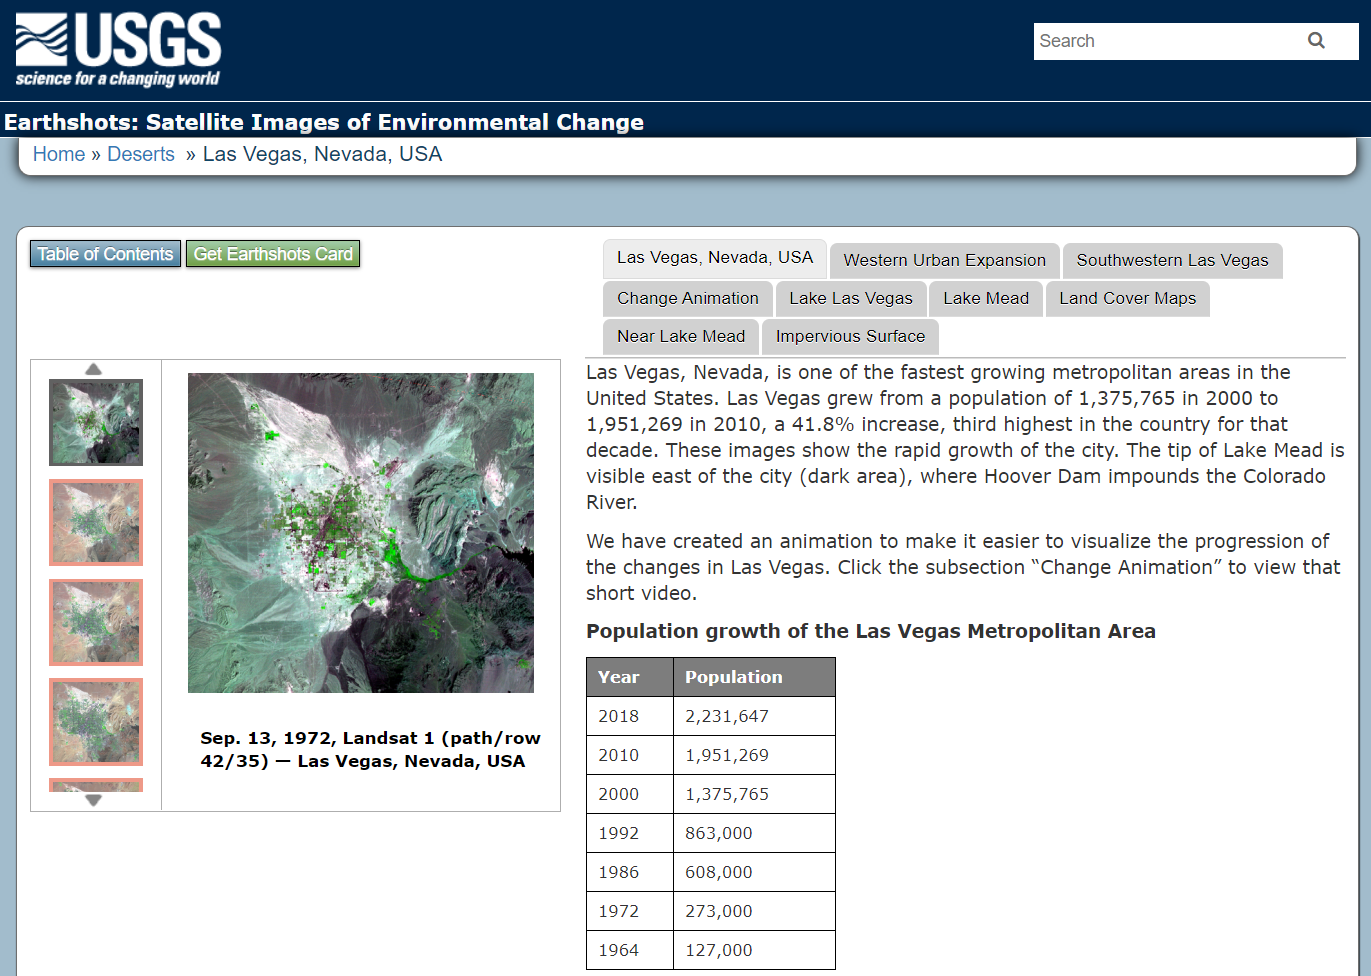
Below are two examples of the trading cards, Mount St. Helens pre/post volcanic explosion and Las Vegas, Nevada population growth over time.


If you view a location on through the browser you will get about 5 images you can review as well as context about the images.
Other Resources: Tracking Change Over Time (teacher guide): https://pubs.usgs.gov/gip/133/pdf/tracking-packet_web.pdf
Lesson Plan – Investigating Deforestation Throught An Earth Systems View Using Landsat: https://mynasadata.larc.nasa.gov/lesson-plans/investigating-deforestation-through-earth-systems-view-using-landsat
IowaView has trading cards available. Please contact Amy Logan for more information.

Just wanted to put out a reminder that the Iowa Map Contest is still going on. It’s a great opportunity for students in grades 4-12 to learn how to tell a story about Iowa’s special places using a story map. Also there are great prizes – $100 and a chance to go to the national map contest.
If you need help getting started, visit the official website and please read the earlier post for more details or send us an email.


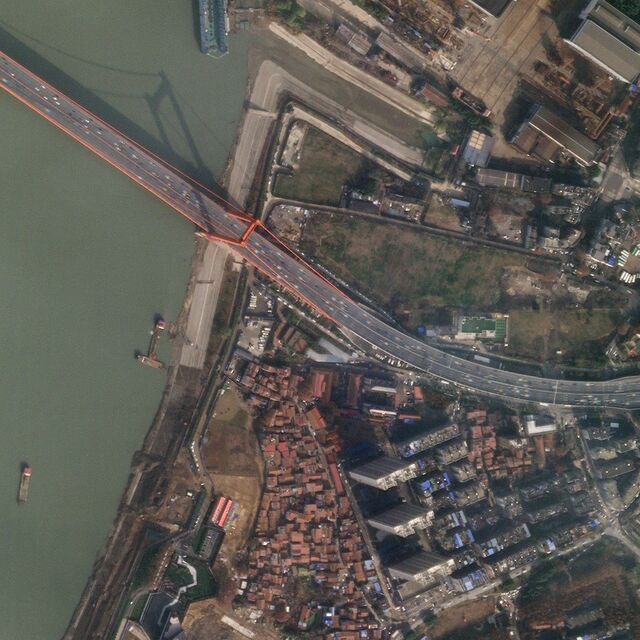
A couple weeks ago Bloomberg News posted an interesting article (click here to read the article) showing how the stay at home orders are effecting areas around the world using high resolution satellite imagery. Below is an example showing Venice, Italy on October 20, 2019 compared to March 18, 2020 after the residents were asked to stay at home. It is interesting to compare the water clarity and traffic.

The article highlights numerous sites around the globe including: Wuhan, China (before shutdown / after shutdown); Mecca in Saudia Arabia; Venice, Italy; Epcot Center in Florida, USA; Tianjin, China; and Miami Beach, Florida, USA.
Resource: What It Looks Like From Space When Everything Stops, Eric Roston, March 24, 2020, Bloomberg.com
As you look out your window you may be noticing that grass is beginning to green up, the lilac bushes are growing new leaves, and a robin is gathering material for a nest. These observations are scientifically termed phenology – the study of cyclic and seasonal natural phenomena relating to climate, plant, and animal life.
As spring begins with many of us social distancing it is a good time to turn our attention towards nature and consider joining the National Phenology Network USA’s Nature’s Notebook program. Nature’s Notebook is a group of volunteer observers (students and citizen scientists) from around the USA who pick an observation site and commit to regularly recording data about it throughout a season. This data can then be used by scientists around the world to better understand changes in climate and plant/animal life around the country.
The Nature’s Notebook website has many useful resources for establishing your observation site as well as ideas for which species to observe. The website also has activities and lesson planning ideas for children and young people. Participating in Nature’s Notebook might be a good adventure during the weeks that school is closed and the days are getting nicer.
Resources:
Phenology Activity Book for Children
Nature’s Notebook – Join a Regional Campaign
Getting Started – Nature’s Notebook in the classroom
Search Plants and Animals to Observe
Learn How to Observe
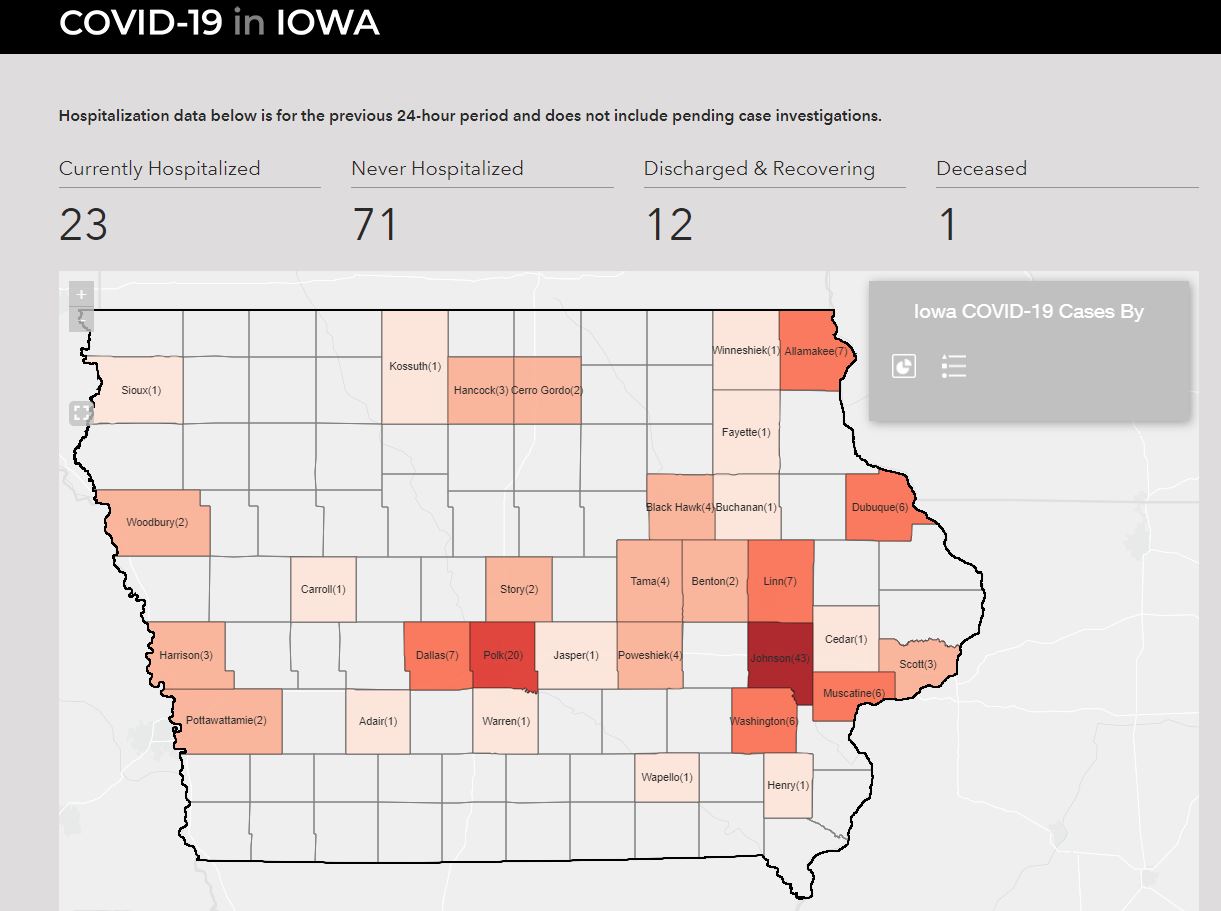
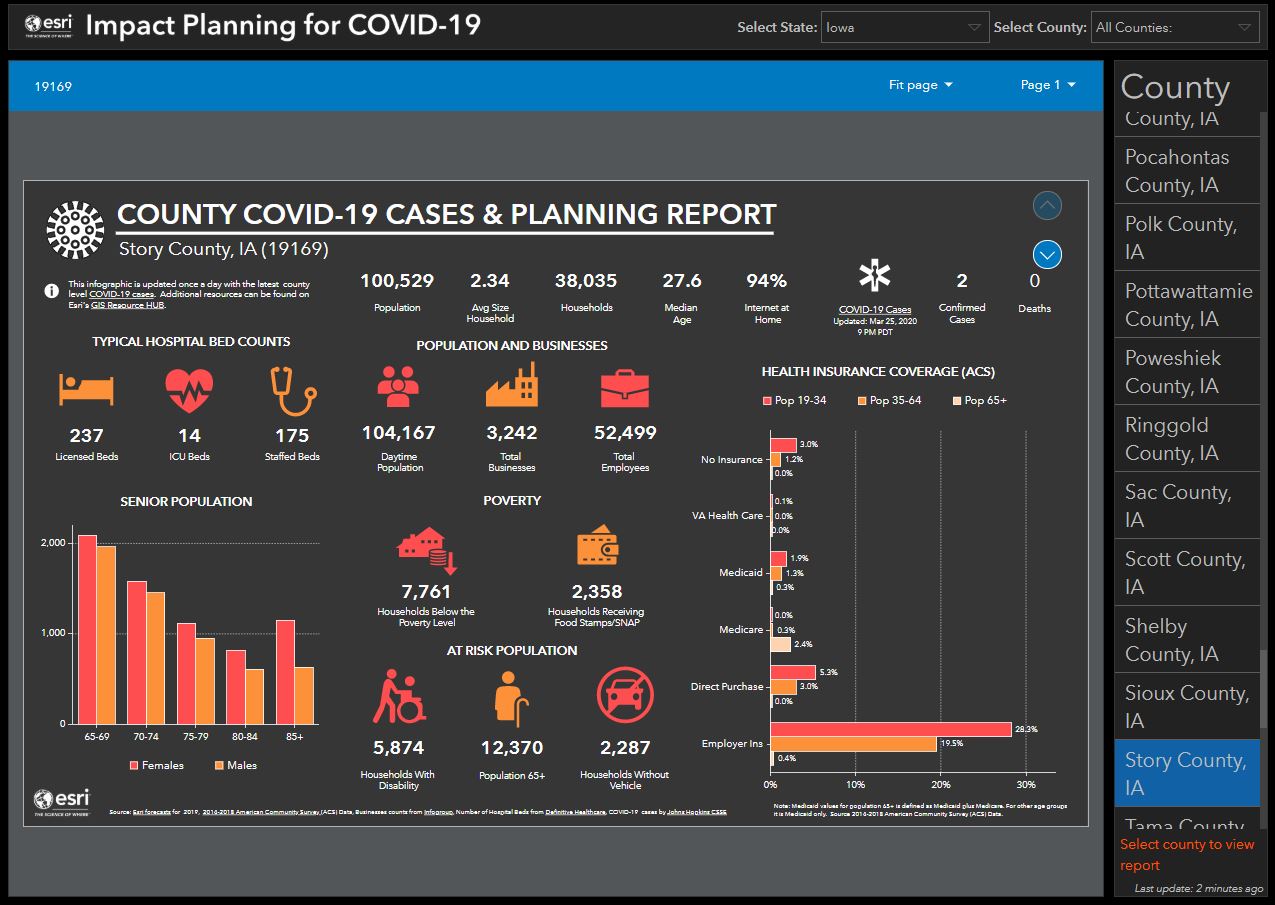
Here are several more maps that are helpful for understanding the COVID-19 spread in Iowa.
The State of Iowa has a COVID-19 page: https://coronavirus.iowa.gov/. There is a map of the the confirmed cases statewide. This page has demographic breakdown of the cases by male/female, age cohorts, as well as hospitalization and recovery information.
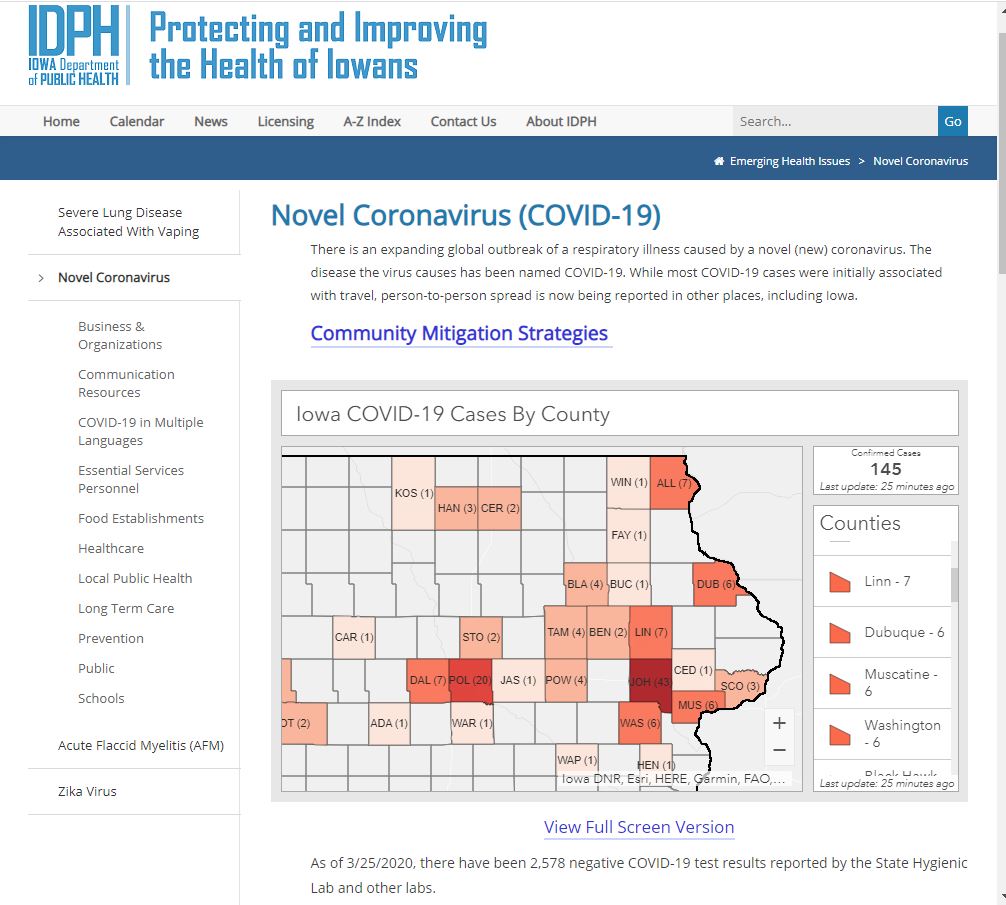
The Iowa Department of Public Health has a similar page: https://idph.iowa.gov/Emerging-Health-Issues/Novel-Coronavirus. One thing I like about the IDPH page is that they have the number of negative COVID-19 tests as well as the positive cases.
An interesting infographic site that is put out by ESRI called Impact Planning for COVID-19: https://business.maps.arcgis.com/apps/opsdashboard/index.html#/dc74772707d94db9a7d24d30ffdcf36c. This site pulls together demographic data, hospital data, insurance data to give a snap shot of each county around the country.
AmericaView College-Level Remote Sensing Resources
GeorgeView – AmericaView University
Website: http://gaview.org/moodle30f/
IowaView – GIS and Mapping Task Sheets
Website: https://www.extension.iastate.edu/communities/gis/quicktasksheets
MinnesotaView – Remote Sensing 101
Website: https://minnesotaview.rs.umn.edu/education
MontanaView – Python and R
Website: http://www.montana.edu/montanaview/
NewHampshireView – Remote Sensing Webinars
Website: http://www.nhview.unh.edu/educations_webinars.html
VirginiaView – Remote Sensing Tutorials
Website: https://www.virginiaview.cnre.vt.edu/education.html
WestVirginiaView – Intro to GIS and R Courses
Website: http://www.wvview.org/course_directory.html
VermontView – Youtube Videos – Intro to GIS and Remote Sensing
Website: https://www.youtube.com/user/joneildunne/videos
AmericaView – Google Earth Engine Tutorials
Website: https://americaview.org/program-areas/education/google-earth-engine-tutorials/
AmericaView – Educational Resource Portal
Website: https://americaview.org/program-areas/education/resources/