Tag Archives: imagery

A New Iowa as Art Piece – Cautionary Waters


Cautionary Waters: Visons of the Past, Planning for the Future


Thanks for coming out to celebrate GIS Day with us!

On Wednesday, November 20, we had a great GIS Day celebration at The Catalyst in Parks Library. Thank you to library digital scholarship staff for hosting us and providing their expertise.

We had five speakers sharing on different topics:

  • CollectionBuilder for Historical GIS: an update on the ISU Historical Buildings ProjectErin Ridnour, Digital Scholarship Librarian, University Library
  • Tillage Detectives: Determining Residue Cover via SatelliteBryce Pape, Graduate Student and Brian Gelder, DEP and GISF Co-Lead
  • Library Instruction with ArcGIS StoryMapsMichael Cummings and Erin Ridnour, Digital Scholarship Librarians
  • Using Past Slope Failures to Prepare for the Future: A Case Study across the State of North DakotaBeena Ajmera, Assistant Professor, Department of Civil, Construction and Environmental Engineering
  • Geospatial Modeling for Regional Trail Planning Austin Dunn, Assistant Professor, Department of Landscape Architecture

Visit the ISU GIS Facility GIS Day website for more details about the speakers: https://www.gis.iastate.edu/gis-day-2024

The Iowa State Daily wrote a nice article about the event which you can read at: https://iowastatedaily.com/305503/news/gis-program-highlighted-with-annual-day-of-celebration/

Disaster at Lake Delhi – #Landsat50

Well, it’s Water Wednesday. Today’s Landsat highlight is a time lapse video (2007-2017) showing the effect of a 2010 dam breach on the water level of Lake Delhi located in Delaware County in eastern Iowa. Notice the dramatic decrease in water and the exposure of large sandbars and the refilling of the lake as the dam is restored.


This year we are celebrating 50 years of the Landsat earth observing satellite mission. Landsat data helps us observe changes in our communities and environment over time.


Celebrating 50 years of Landsat Earth Observation!

Saturday, July 23, 2022 marked the 50th anniversary of the launch of the USGS/NASA Landsat earth observing satellite mission. With the launch in 1972, Landsat has continued its earth observation mission and become the longest continuous earth observing satellite.

July 1972 – Landsat 1 Launch: This image is from the NASA website: https://www.nasa.gov/directorates/heo/scan/images/history/July1972.html

Enjoy this video recalling the launch and explaining the beginning of the earth observing satellite mission, Landsat 9 – Part 1: Getting off The Ground: https://www.youtube.com/watch?v=FlRf17Egexo.


Keep Observing!


Happy Summer Solstice Week! Let’s head to the lake!

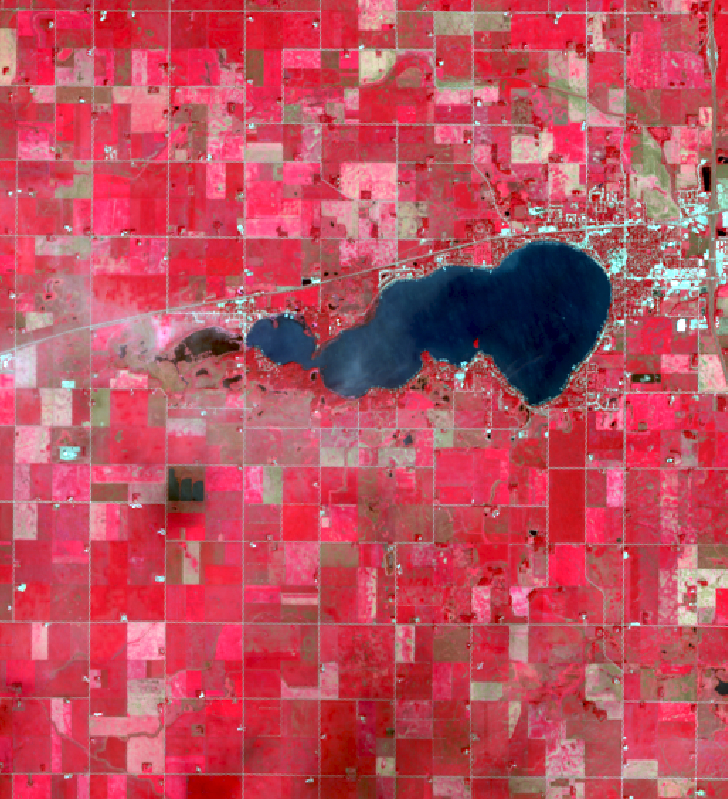
We are continuing our celebration of the 50th year of the US Landsat satellite imagery program. This week we are heading to the lake – Clear Lake, Iowa, located in north central Iowa.

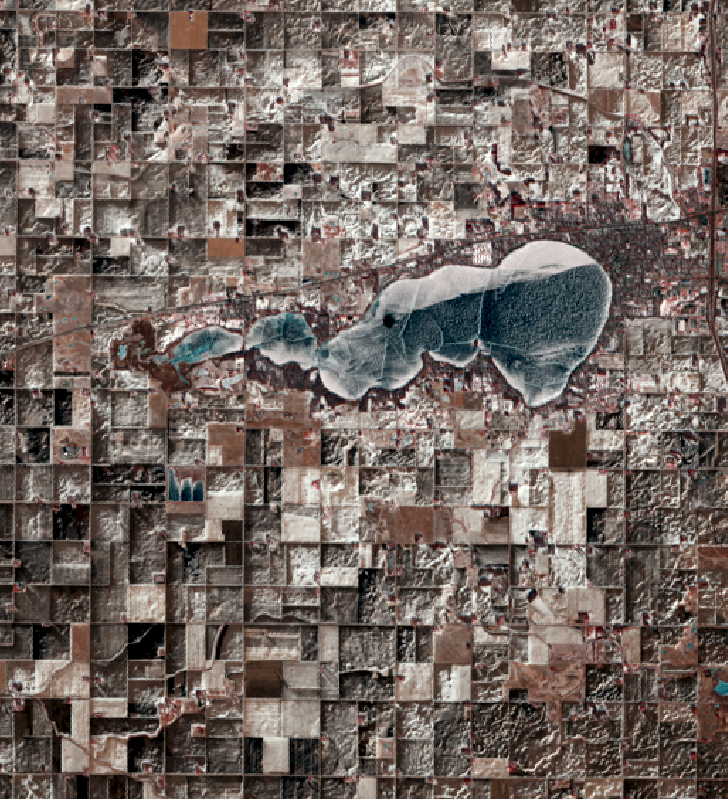
Below are four images showing Summer Solstice (6/13/2019), Fall Equinox (9/17/2019), Winter Solstice (12/22/2019), and Spring Equinox (3/18/2019) from Landsat 8. The images are presented in color infrared which shows vegetation in red rather than green for better contrast.

Observations:

  • At Summer Solstice things are still greening up while at Fall Equinox the fields are all green and some are beginning to be harvested.
  • Observe the different states of the lake: open water, snow covered, and frozen.
  • The topography of the landscape (ie. hills and roughness) are much more apparent with snow on the ground. In the summer/fall images, it all looks flat.

What else do you notice? Happy Observing!


Traveling Way Back – Landsat Images From Aprils Gone By

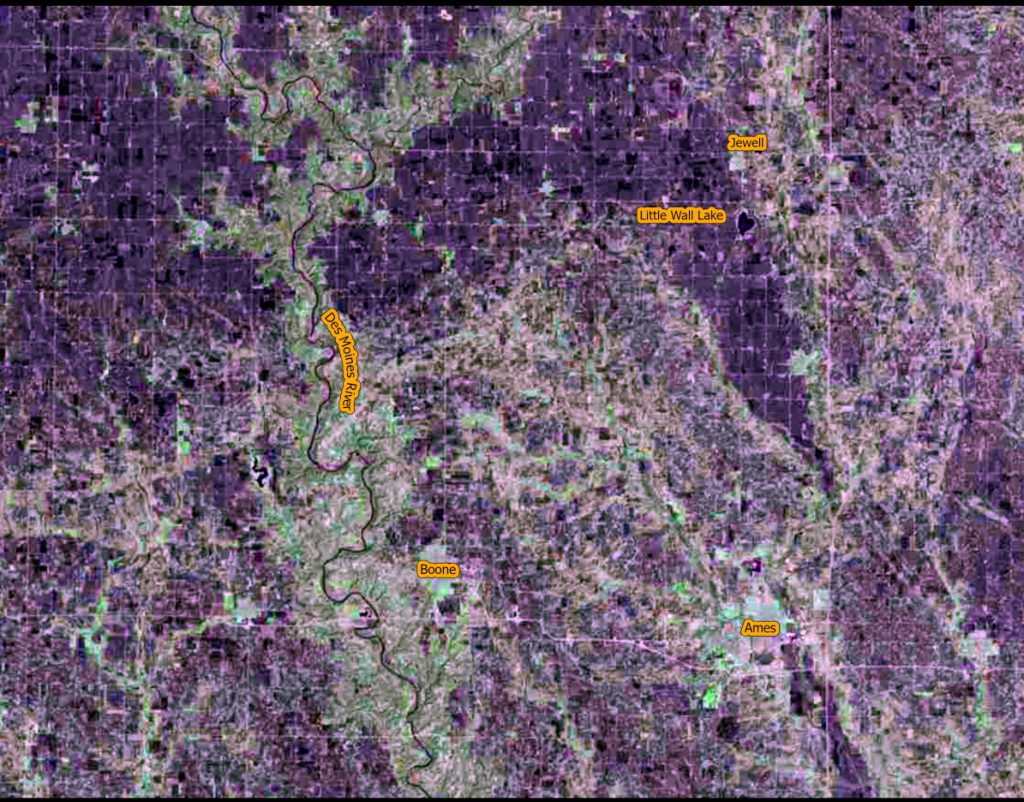
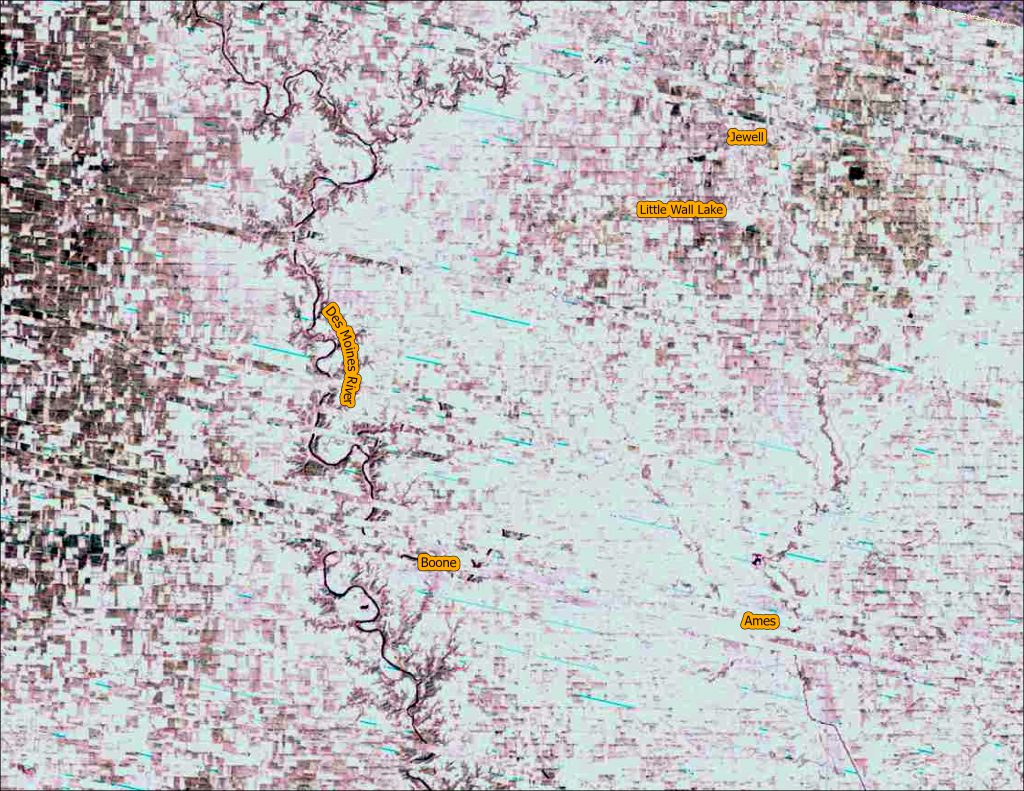
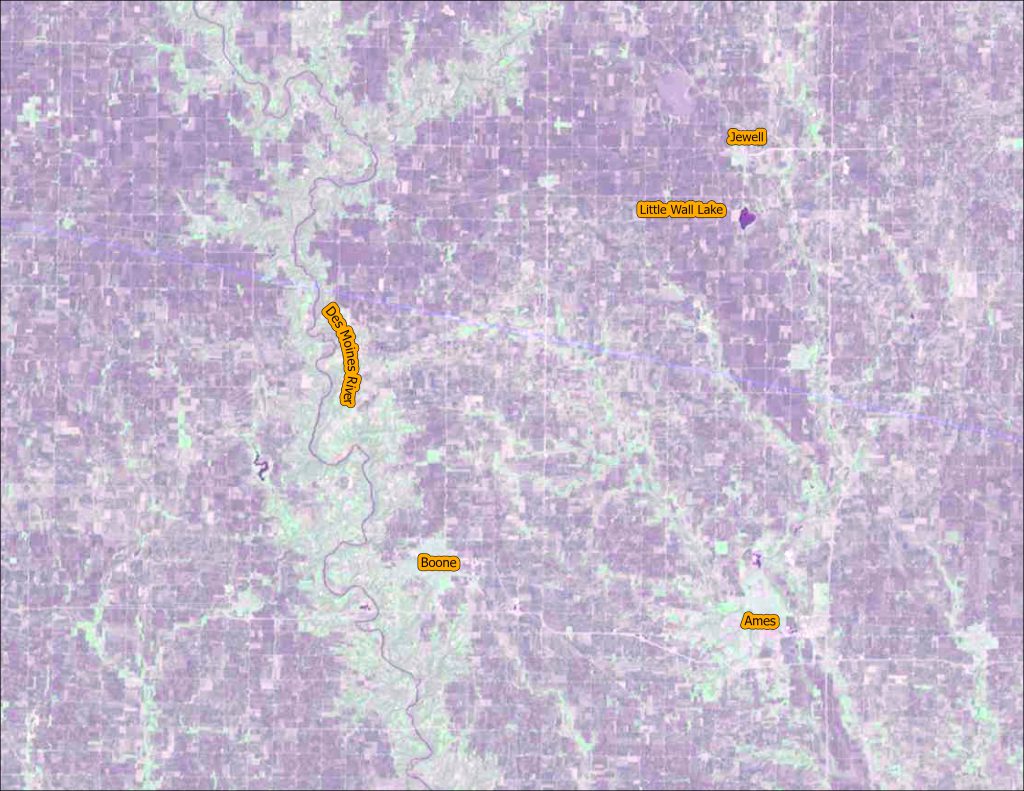
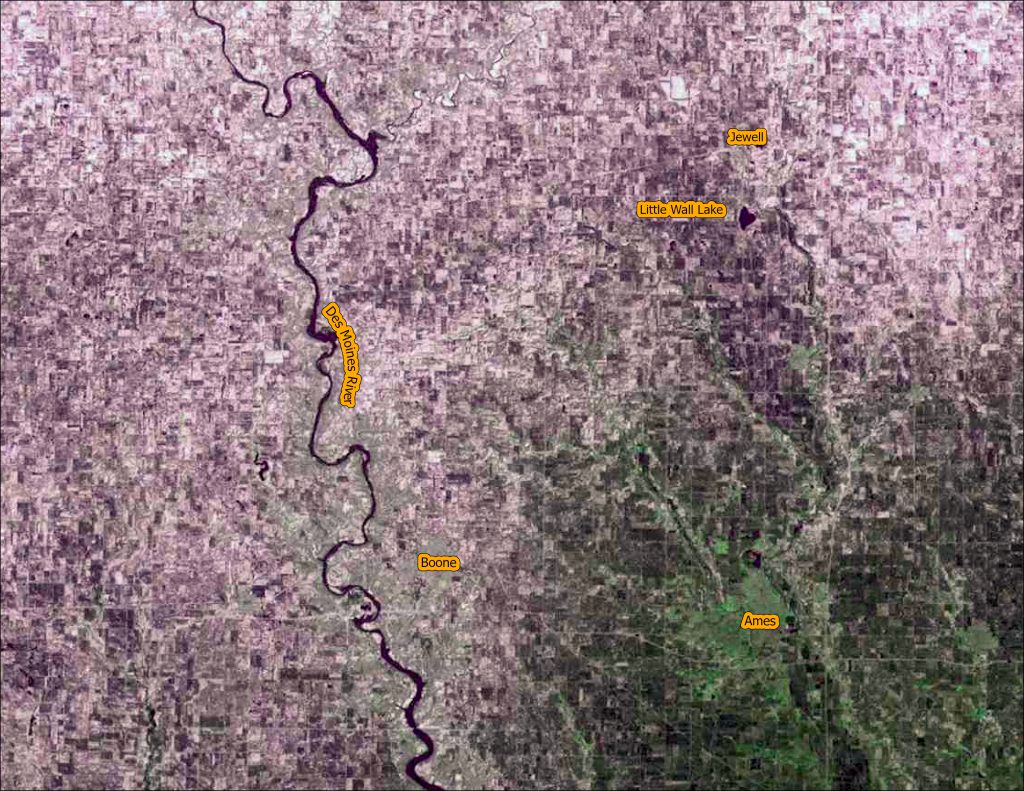
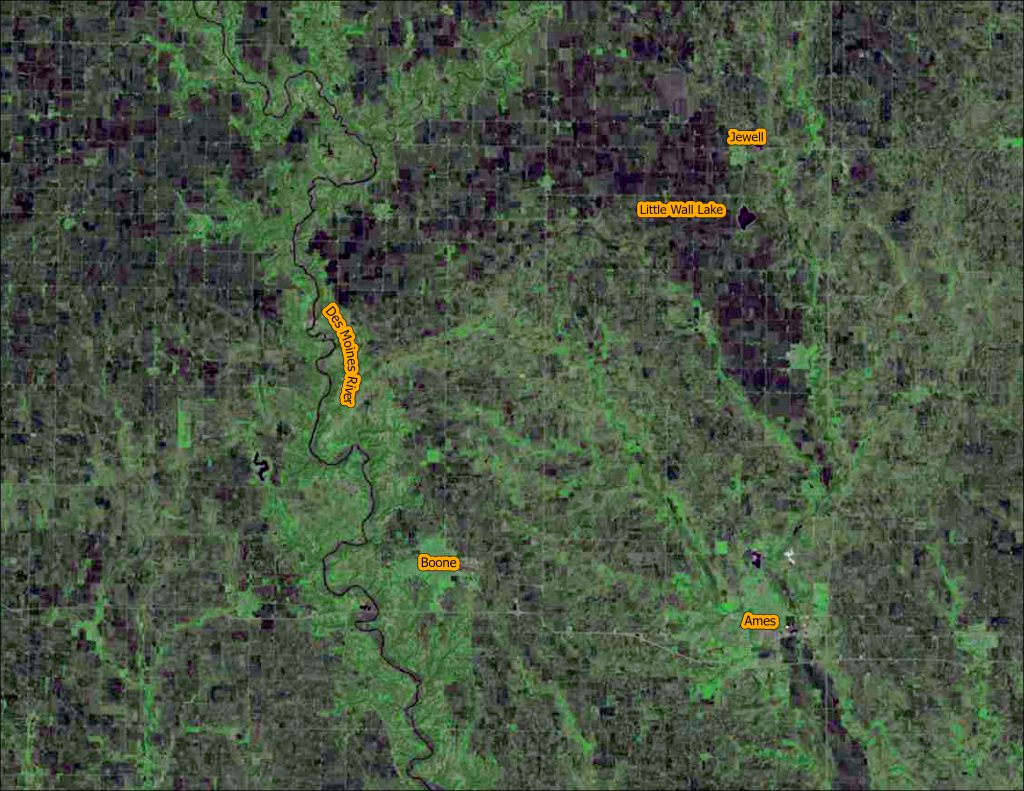
Welcome to another Throwback Thursday. Today we are going back into the archives to compare imagery from the first five Landsat satellites (all images are featured in natural color). Click on each image for a closer view.

  • Try to notice the differences in resolution and image quality between the different years.
  • Another thing to note is the wide seasonal variation between the images. All the images were from the same three week period in April. Some images are have snow while other years are very green.
  • Observe that the Des Moines River is swollen in the Landsat 4 -1983 image.
Landsat 1 – April 5, 1976
Landsat 2 – April 3, 1975

Landsat 3 – April 21, 1980
Landsat 4 – April 15, 1983
Landsat 5 – April 12, 1985

You can explore the raw images using this web app: https://arcg.is/0XrG4f. Happy exploring.


This year we are celebrating 50 years of the Landsat earth observing satellite mission. Landsat data helps us observe changes in our communities and environment over time.


Thanks for stopping by and keep observing the world around you!

#TimeLapse Tuesday – Spot the Change – Urban Growth of Ankeny, Iowa

What changes do you notice in this Landsat time lapse video?

1) The areas of purple and white in the image are urban areas. Throughout the video they fill in the area from the bottom to the center. The pink areas are farm land.

2) Did you notice the increase in the number of retention ponds (dark blue specks in the urban areas) over time? Retention ponds are used to prevent flooding and provide for water storage in urban areas. As areas become urbanized there is often more surface covered in concrete, parking lots and buildings. There are fewer places for the water to flow directly into the ground.

3) Did you spot the golf course on the northern edge of the city?


This year we are celebrating 50 years of the Landsat earth observing satellite mission. Landsat data helps us observe changes in our communities and environment over time.


This video was created using Google Earth Engine. You can create your own time lapse videos by visiting: https://emaprlab.users.earthengine.app/view/lt-gee-time-series-animator.

Summer 2021 NAIP Imagery Now on ISU Orthoserver

Iowa Statewide summer 2021 imagery is now available as a webservice from the Iowa Geographic Map Server. https://ortho.gis.iastate.edu/arcgis/rest/services/ortho
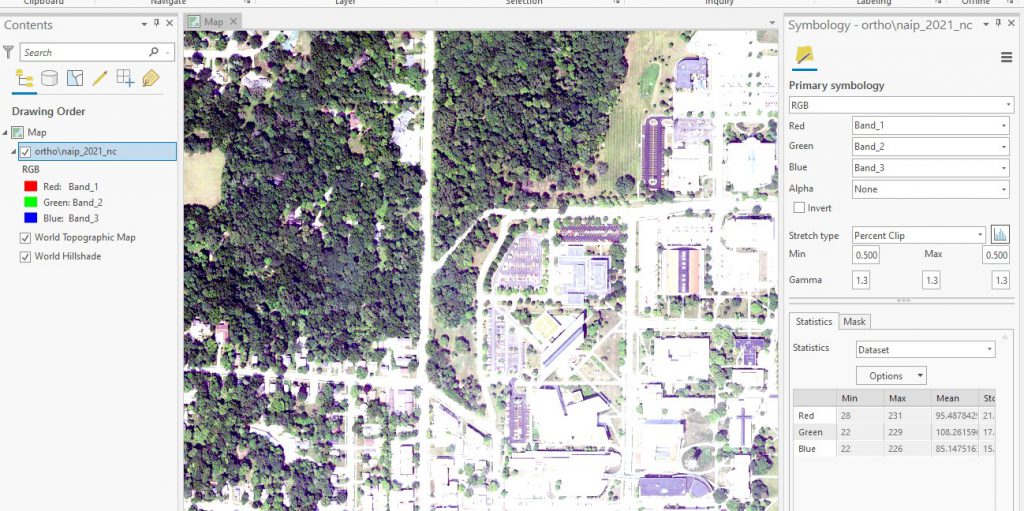
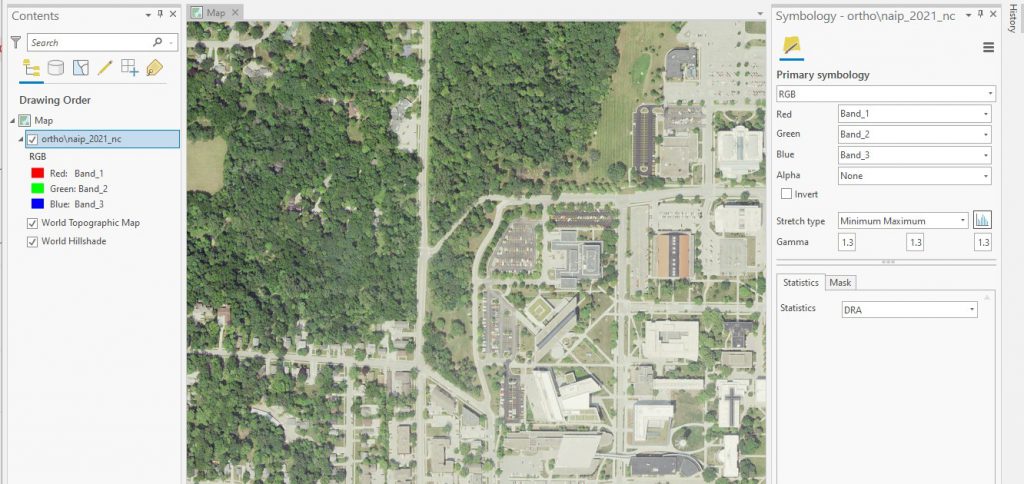
Please note: you may have to adjust the symbology to get the best color.

Here are some suggestions for doing this is ArcGIS Pro, within the Symbology tab, use the dropdown menus to adjust the color.

  • Change Stretch type to Minimum Maximum.
  • Also consider changing the Statistics from Dataset to DRA (Dynamic Range Adjustment). See the example below.
Before Adjustments

After Adjustments