Happy Thanksgiving! Two maps showing the hubs of dinner staples
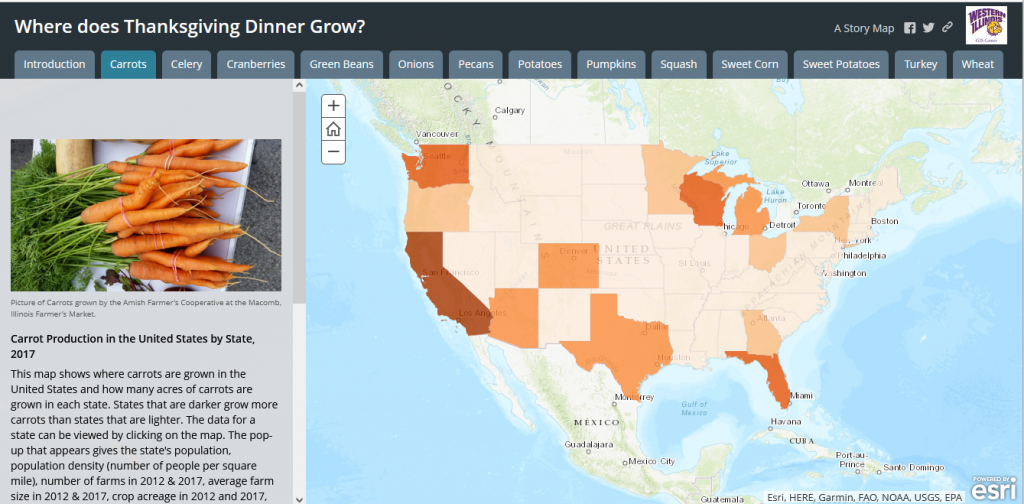
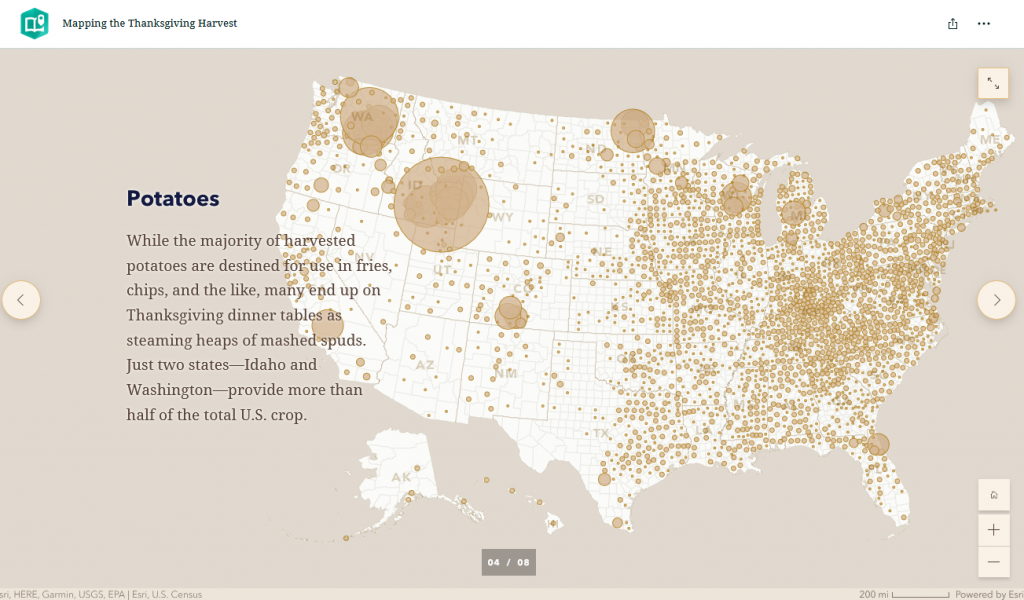
This week as you gather with family and friends for a nice holiday meal take a minute to think the people who grew or produced your food and about all the places different staples come from. Below are two maps, “Where does Thanksgiving Dinner Grow?” created by Linda Zellmer and “Mapping the Thanksgiving Harvest” by David Asbury. Click on the map images below to explore the maps.

Linda Zellmer, a Government Information & Data Services Librarian at Western Illinois University has a series of maps showing the states with the high production of Thanksgiving staples using 2017 data. Linda created maps for the staples data over the course of a 20 year period (1997-2017). For her GIS data, maps, and a Thanksgiving meal poster visit: http://faculty.wiu.edu/LR-Zellmer/thanksgiving.html

David Asbury, a member of the Esri StoryMaps Team, created this map series which shows production of staples at the county level using 2012 USDA Census of Agriculture data.
